The key insight is that a catalyst is not a single event. It is a lifecycle of three distinct phases, each with different optimal behaviour for a systematic strategy. 1. Anticipation (days to weeks before the event). The market begins to price in expected outcomes. Implied volatility rises. Some informed traders position. Public information is incomplete but rumours circulate. 2. Event (the moment of disclosure). New information is revealed. Price discovery is rapid and noisy. Bid-ask spreads widen. Adverse selection peaks. 3. Decay (hours to days after the event). The market digests the new information. Prices converge to a new equilibrium. Implied volatility falls. Spreads normalise.
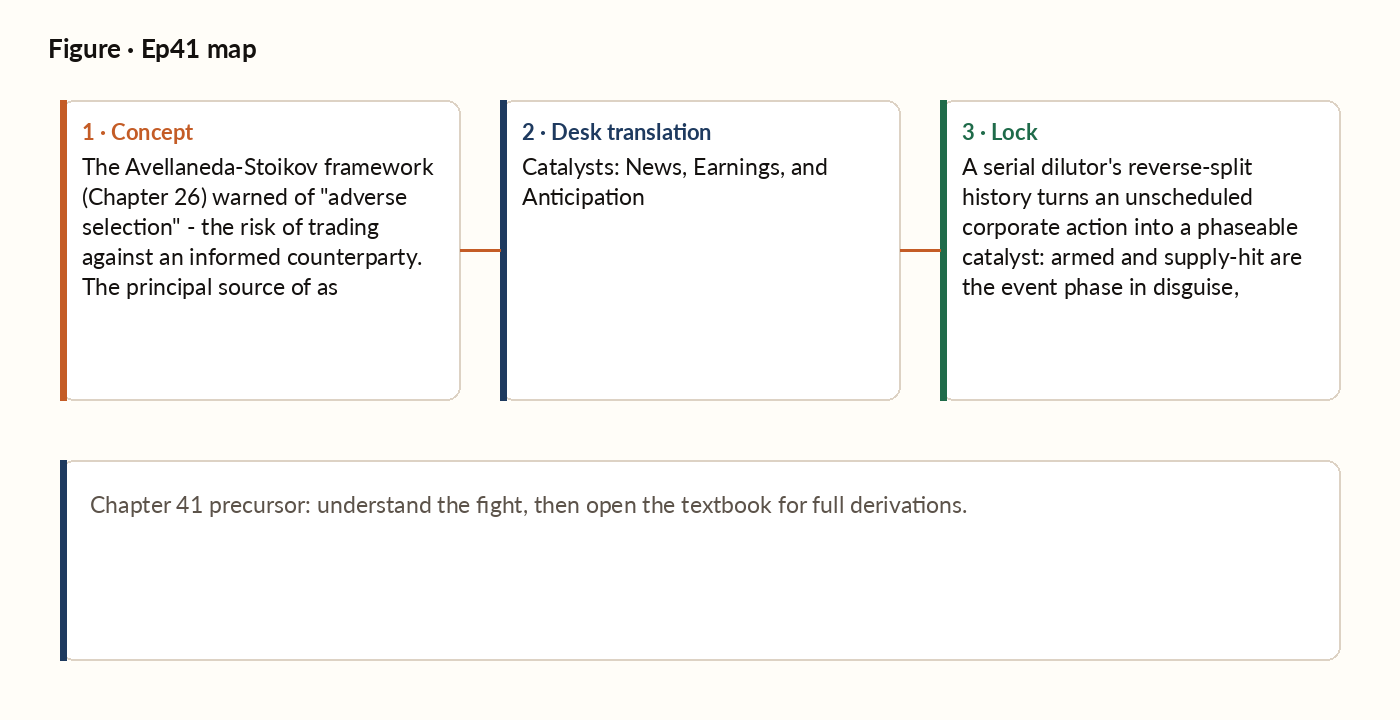
Figure 1. Concept map for this episode: fight, desk translation, what to lock.
The catalyst lifecycle
1. Anticipation (days to weeks before the event). The market begins to price in expected outcomes. Implied volatility rises. Some informed traders position. Public information is incomplete but rumours circulate. 2. Event (the moment of disclosure). New information is revealed. Price discovery is rapid and noisy. Bid-ask spreads widen. Adverse selection peaks. 3. Decay (hours to days after the event). The market digests the new information. Prices converge to a new equilibrium. Implied volatility falls. Spreads normalise. A systematic strategy needs a stance for each phase. In anticipation, cautious, small positioning around a calibrated view of the likely outcome is the best opportunity - the direction of the surprise is analysable, even if its exact size never is. During the event itself, the discipline is simply to stay out: the traders who have prepared for this specific announcement hold an information edge no systematic outsider can match in the moment, so firing new entries here is betting blind. Decay is usually the richest window for a strategy with edge on the post-event direction - the news is now public, the playing field is level again, and small dislocations between price and fair value are exploitable.
The earnings drift phenomenon
The most-studied catalyst is corporate earnings. The empirical literature (Bernard and Thomas 1990; Foster, Olsen, and Shevlin 1984) documents a robust pattern: stocks that report earnings surprises (positive or negative) tend to continue drifting in the direction of the surprise for 30-60 days. This is the post-earnings announcement drift (PEAD), and it is one of the most persistent anomalies in cross-sectional return literature. The mechanism is debated, but the leading explanations involve: analysts underreacting and taking weeks to fully revise their estimates after a surprise; investors anchoring on their prior expectations and updating only gradually as new information accumulates; and mandate constraints, where funds limited from holding certain flagged names create temporary supply and demand imbalances that take 30-60 days to resolve.
The Reddit / anticipation signal
Modern social media has created a new pre-event signal: retail discussion volume. The empirical pattern: stocks experiencing a surge of retail discussion on platforms like Reddit's WallStreetBets often lead the wire news by hours or days. Tracking the lead-lag between retail mentions and traditional news coverage produces a useful pre-event indicator.
Corporate-action catalysts: the dilution–reverse-split cycle
Not every catalyst is scheduled. Earnings and macro releases are announced calendar events with known anticipation windows. A different class of catalyst - dilution, followed eventually by a forced reverse split - is self-inflicted by the company and repeats on an unscheduled, company-specific cadence. It is still, however, the same three-phase lifecycle from §41.1 seen from a different angle: a repeat offender's cap table is the catalyst, and its history of prior reverse splits is the pre-event chatter. One at-the-market offering is noise - plenty of legitimate companies raise capital once and never need to again. But a company whose only path to solvency is repeated share issuance develops a cycle: issue shares to raise cash, the float grows and price falls under the new supply, exchange listing rules eventually force a reverse split to restore a minimum price, and the reduced share count buys a few months before the next raise starts the cycle again. The second reverse split is the tell - it converts one dilutive event into a name that behaves like a recurring catalyst, phaseable the same way an earnings cycle is. Tracking the count of reverse splits and days since the most recent one places a name into one of five phases: setup (no recent split - a dilution history exists but nothing fresh is triggered), armed (0-15 days since the last split - compliance-window supply risk is highest), supply hit (15-45 days - new issuance often lands in this window and pressures price), post-drift (45-90 days - supply pressure fades but price often keeps drifting rather than resetting cleanly), and flat-tape (90+ days - volatility compresses back toward the pre-cycle baseline). The textbook walks the same five-phase cycle under different names and boundaries (quiet, fresh-cut, overhang, fading, reset, at roughly 0-10 / 10-35 / 35-75 / 75+ days) - both sets of thresholds are explicitly illustrative, not universal constants; a production screen should refit them from its own walk-forward data rather than borrow either one.
Worked picture
Suppose three names report these earnings surprises: Name A beats consensus by $0.08/share on a typical surprise size of $0.04, for a standardised surprise of +2.0 (a large positive surprise). Name B beats by just $0.03 on a $0.05 typical size, for a standardised surprise of +0.6 (unremarkable). Name C misses by $0.10 on a $0.05 typical size, for a standardised surprise of -2.0 (a large negative surprise). Long the top decile / short the bottom decile reduces to long A, short C in this toy cross-section; B is neutral. Hold 30-60 days; recalibrate annually as drift magnitude decays. The edge is in the rank, not the dollar surprise.
What breaks in production
PEAD requires a consensus estimate against which to compute the surprise. For widely-covered large-cap names, consensus is well-defined: 20+ analysts contributing estimates. For small-cap or thinly-covered names, "consensus" might be one or two analysts - and an "earnings surprise" against that consensus is not very informative. The fix: only run PEAD on names with at least 5 analyst estimates contributing to consensus. For thinner-coverage names, the signal is too noisy to be worth trading.
Key idea
A serial dilutor's reverse-split history turns an unscheduled corporate action into a phaseable catalyst: armed and supply-hit are the event phase in disguise, post-drift and flat-tape are decay in disguise. The cycle gap is the tell that separates a tradeable pattern from a terminal slide.