The principle is simple: a trading book has a maximum risk budget - say, 2% of capital at risk per day. In calm regimes, the full budget is deployed. In stressed regimes, only a fraction (perhaps 50%) is deployed. The regime classifier determines the multiplier, and every per-trade Kelly bet scales by that multiplier. In a crisis, the system withdraws to cash, preserving capital for the eventual return of normal conditions. The reason this works is not glamorous. It works because the worst times to be aggressive are precisely the times the market is paying the highest premium for liquidity provision, and the cheapest times to be aggressive are precisely the calm regimes when nothing seems to be happening. A constant-risk strategy fights this gradient; a regime-aware overlay rides with it.
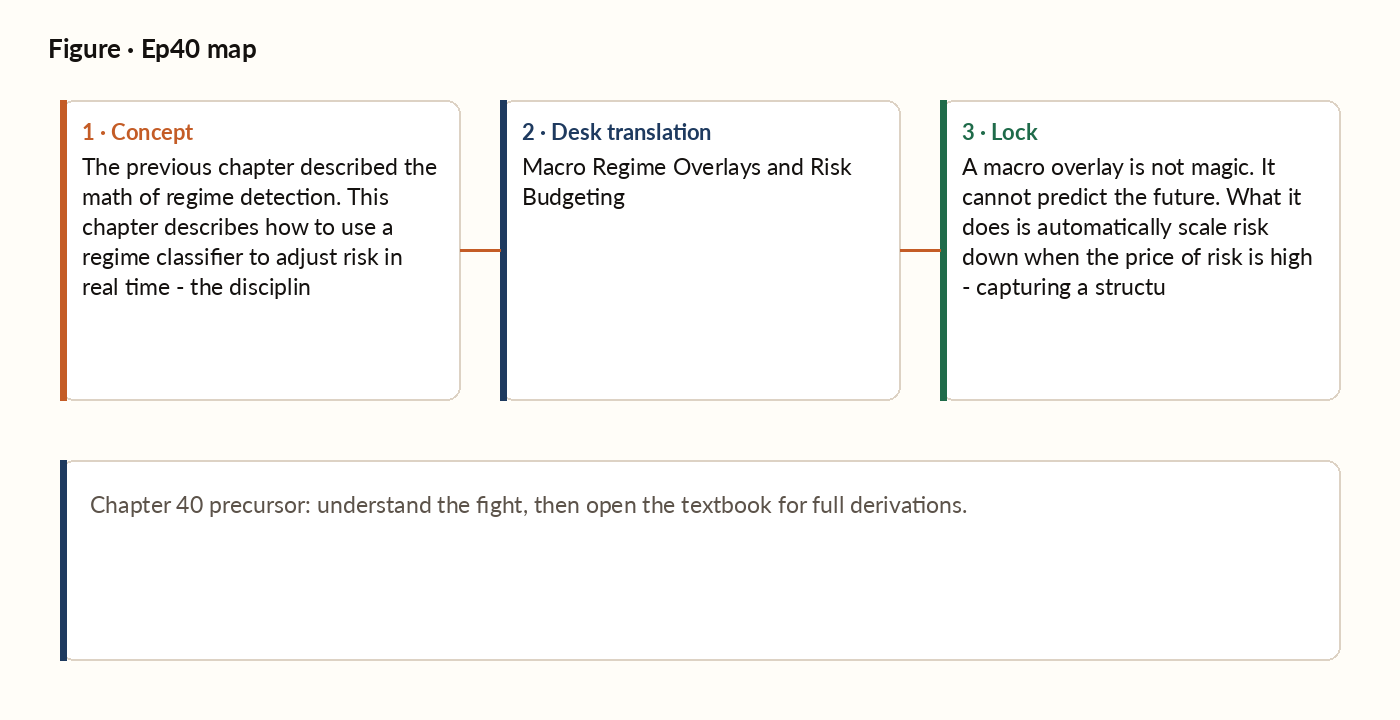
Figure 1. Concept map for this episode: fight, desk translation, what to lock.
The risk-budget framework
The strategy's per-trade Kelly bets and concentration limits all scale by the multiplier. In a calm regime, the strategy operates at full capacity. In a crisis, it withdraws to cash, preserving capital for the eventual return of normal conditions.
The multiple layers of macro overlay
A complete macro overlay typically combines five independent layers. Volatility regime: VIX, India VIX, trailing realised vol on the broad index - high vol means reduce, capturing the cross-asset price of risk. Trend regime: whether the index sits above or below its long-term moving average, breadth of new highs vs new lows - a strong downtrend means reduce, capturing price-action context. Liquidity regime: bid-ask spreads, volume relative to recent average, options skew - stressed liquidity means reduce, capturing the cost of getting in or out at scale. Catalyst calendar: known upcoming events like central bank decisions, major earnings, geopolitical risk - reduce ahead of large unknowns, capturing expected future volatility. Internal regime: the strategy's own recent performance and calibration - drift in its own accuracy means reduce until investigated, capturing whether the system's own signal is still working. Each layer contributes a multiplier, and the product of all five is the final risk scale.
Walking back into full size
Reducing size during stress is easy. Walking back to full size after stress passes is harder - every operator has the temptation to wait "just a little longer" to be sure. The discipline is to define the entry rule for each regime symmetrically with the exit rule. If the system reduces to 0.5× when stressed-probability exceeds 0.70, it should return to full size when stressed-probability drops below (say) 0.30. The gap (0.70 entry, 0.30 exit) is a hysteresis band that prevents whipsaw transitions when the regime probability fluctuates around a single threshold.
Worked picture
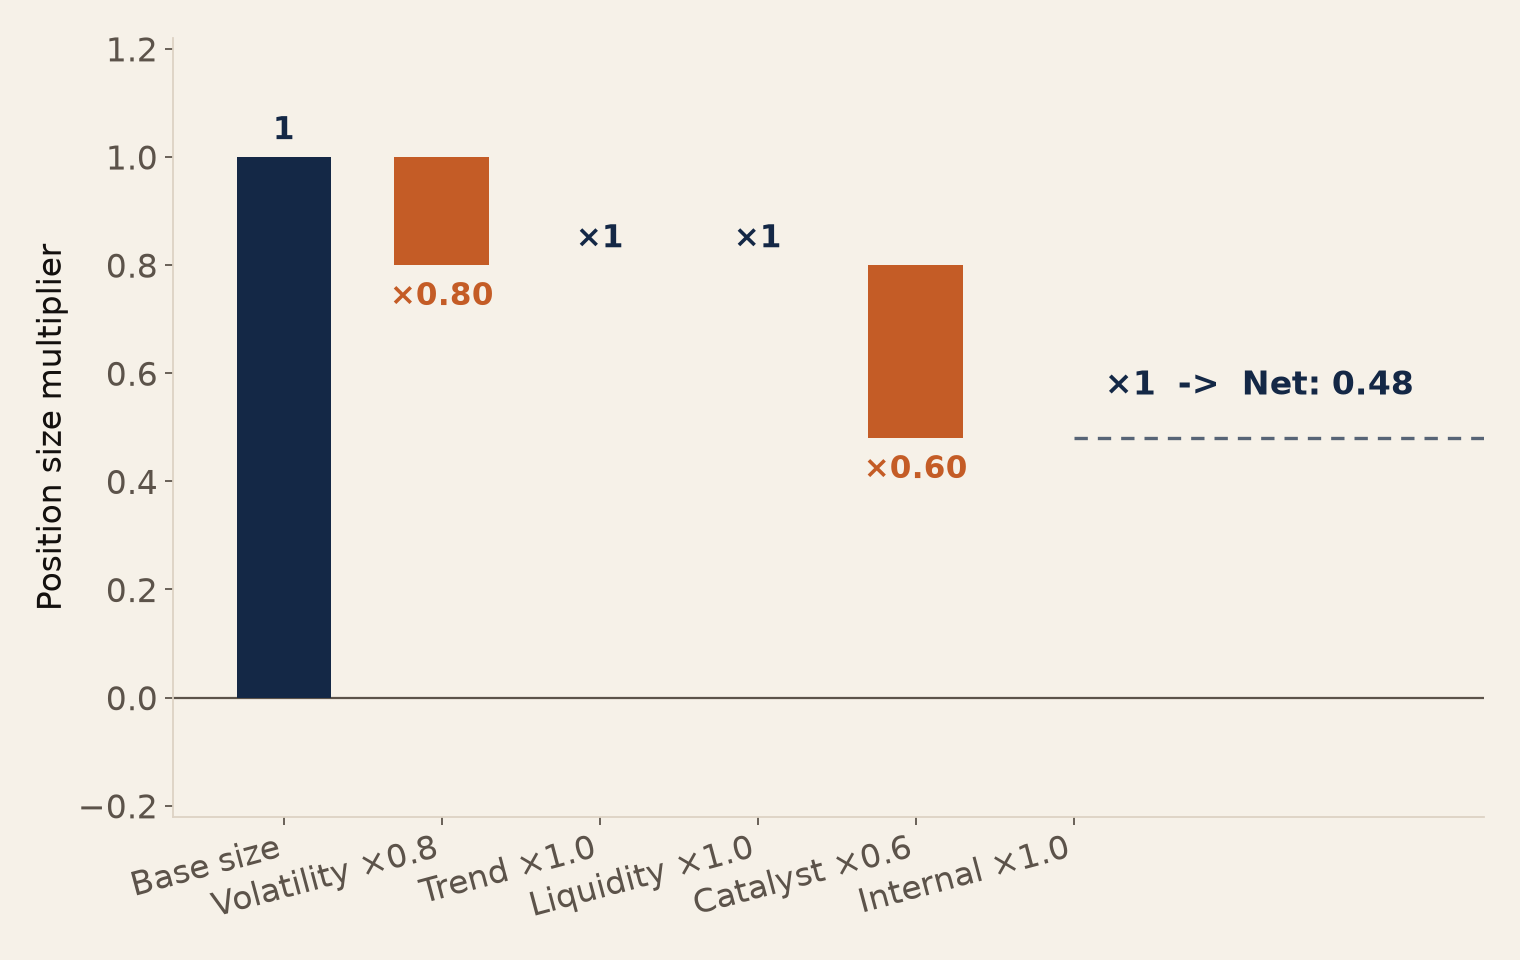
Suppose the five layers report: - Volatility: 0.8× (vol slightly elevated but not stressed) - Trend: 1.0× (broad market in normal uptrend) - Liquidity: 1.0× (spreads normal) - Catalyst: 0.6× (Fed meeting tomorrow) - Internal: 1.0× (Brier score in normal range) The final risk multiplier is 0.8 × 1.0 × 1.0 × 0.6 × 1.0 = 0.48. The strategy operates at 48% of full size today, primarily because of the catalyst risk. Tomorrow, after the Fed meeting passes, the catalyst layer reverts to 1.0× and the overall multiplier returns to 0.8 (assuming volatility has not changed).
Figure. The five layers cascading multiplicatively to a 0.48x final size, driven mainly by tomorrow's Fed meeting.
This is the discipline at work: each layer contributes its independent signal, the product is automatic, and no one has to argue about whether the Fed meeting "matters." It mattered by design, the multiplier reflected that, and the system adjusted size accordingly.
What breaks in production
A common mistake is to add the layers (one positive offsets one negative) rather than multiply them. This is wrong. Risk multipliers compose multiplicatively because they each measure a fractional reduction in safe capacity - and fractional reductions stack. If your model is in stress (0.5×) and there is a catalyst tomorrow (0.5×), you should be at 0.25×, not at the average 0.5×. The risks are independent and they compound. Addition would let one good signal "cancel" one bad signal, which is not how risk actually works.
Key idea
A macro overlay is not magic. It cannot predict the future. What it does is automatically scale risk down when the price of risk is high - capturing a structural reality that is invisible to a constant-risk strategy. The discipline of trusting the overlay through both directions (down when stressed, back up when calm) is what separates systems that survive their first real crisis from those that do not.