The answer is given by one of the most important theorems in mathematics, the Law of Large Numbers. Informally: if you repeat an experiment many times, the sample average of the outcomes converges to the true expected value. Formally, in two flavours (weak and strong), the law specifies exactly what "converges" means and how fast convergence happens. This chapter develops the law carefully, derives the formula for how long it takes for a strategy's realised profit to converge to its expected value, and connects the result to the operational discipline of "trust the system."
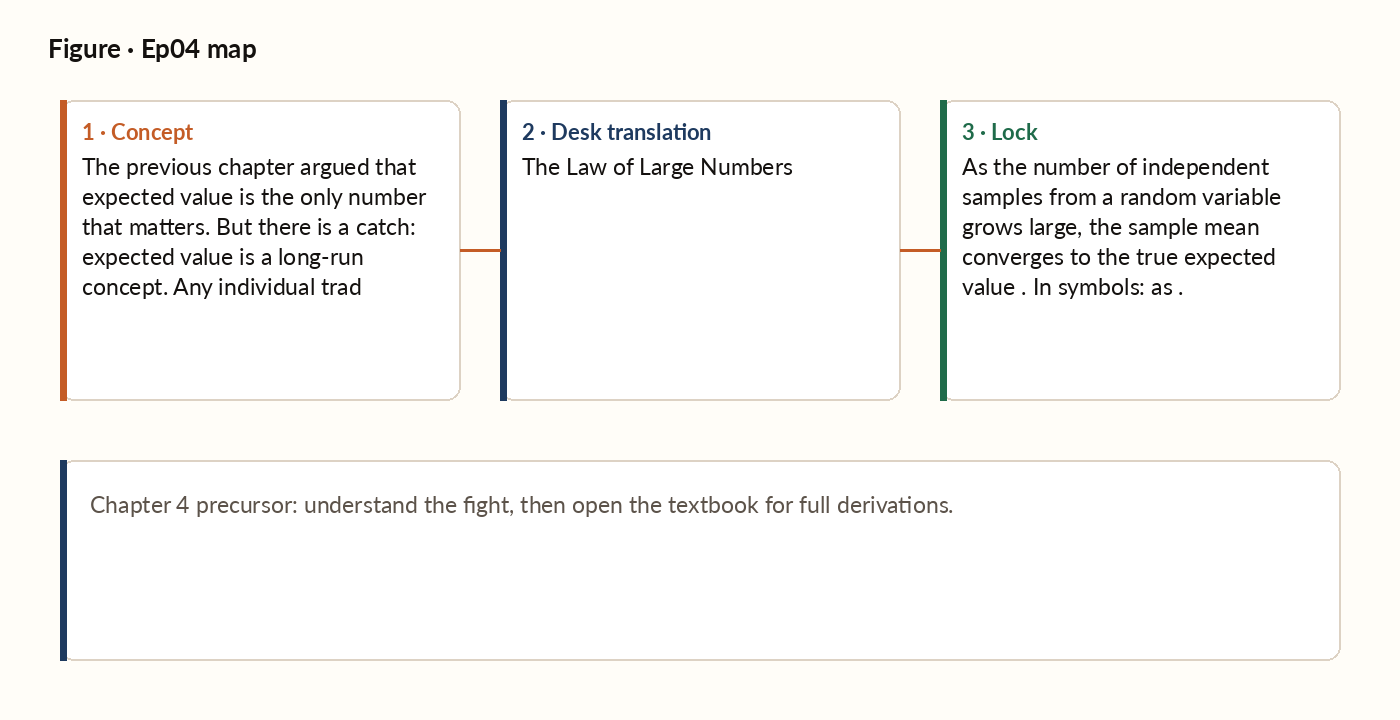
Figure 1. Concept map for this episode: fight, desk translation, what to lock.
The intuitive law
Imagine flipping a coin biased at 55% heads, many times. After one flip, your sample proportion is either 0 (you got tails) or 1 (you got heads). After ten flips, the sample proportion is somewhere between 0 and 1 but probably not close to 0.55 - it might be 0.4 or 0.7 with reasonable frequency. After a hundred flips, it is usually within a few percentage points of 0.55. After a thousand flips, it is almost always within one percentage point. After ten thousand flips, you can essentially read off 0.55 with high confidence. That is the law of large numbers. The more samples you have, the closer the sample average gets to the true expected value.
The square-root rule: convergence speed
The law of large numbers tells you that convergence happens. It does not, by itself, tell you how fast. For that, we need the central limit theorem (Chapter 5) and the idea of standard error. For a coin-flip-style bet, the uncertainty in your sample average shrinks as you collect more trades - but it shrinks slowly: to cut the uncertainty in half, you need four times as many trades, not twice as many. That is the square-root rule, and it is the single most important practical consequence of this chapter.
How many trades until you can prove the edge?
Let's apply the law of large numbers to a concrete trading question: how many trades do you need before you can statistically distinguish a 55% win rate from a 50% win rate? We frame this as a hypothesis test. The null hypothesis is that the true win rate is 0.50 (no edge). The alternative is that the true win rate is 0.55 (your claimed edge). After enough trades, you observe a sample win rate, and you reject the null in favour of the alternative if that sample win rate is far enough above 0.50 to be unlikely under "no edge." Working through the statistics, distinguishing 55% from 50% with reasonable confidence takes roughly 620 trades - and a smaller edge needs dramatically more: about 3,800 trades to confirm a 52% edge, and over 15,000 to confirm a 51% edge.
The implication for systematic trading
The law of large numbers has three direct consequences that shape every chapter of this book. First, you cannot trust early results. A strategy that wins its first ten trades is not validated. A strategy that loses its first ten is not falsified. Either of those outcomes is well within the noise envelope of essentially any reasonable underlying win rate. Drawing conclusions about a strategy from fewer than a hundred trades is statistically meaningless.
Worked picture
Flip a coin biased at 55% heads, fifty times. The expected number of heads is about 27.5. A realised count of 24 heads gives a sample rate of 48% - below fair-coin territory, even though the coin is biased toward heads. The uncertainty on that estimate is large enough that a 95% confidence band around the true rate spans roughly 41% to 69%. Fifty trials cannot narrow the case; they only open it.
What breaks in production
A common pattern: a trader runs a system for two months and notices that the realised win rate is 0.62 - substantially above the modelled 0.55. The trader concludes the model was underestimating the edge and increases position sizes accordingly. Six months later, the realised win rate has settled to 0.53 - below the model. The increased position sizes are now amplifying losses on what was already a marginal strategy. The error: treating early-window noise as signal. Two months of trades is well within the noise envelope of either a 0.53 or 0.62 true win rate. Position sizing should be set by the prior expectation, not the recent realised mean, and re-calibrated only after a statistically meaningful number of trades have accumulated (typically a few hundred at minimum, per the trade-count arithmetic above). Sizing on the recent mean is exactly the trap the law of large numbers warns against.
The Law of Large Numbers (informal)
As the number of independent samples from a random variable grows large, the sample mean converges to the true expected value - the more trades you take, the closer your realised average gets to the theoretical edge.