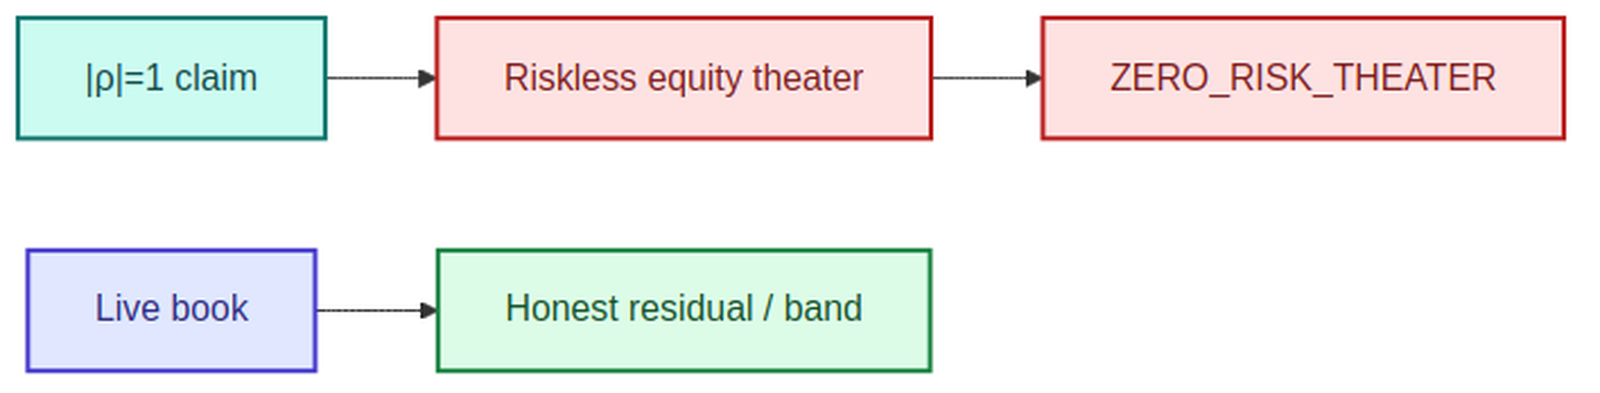
Simple claim: correlation exactly minus one hands you zero variance and a positive return, that is an arbitrage claim, and no estimate is ever exactly minus one. The trench is boundary correlation as refuse, not discovery.
The previous post's phantom needed a rank-deficient matrix and a hundred names. The two-asset version needs no matrix at all, fits on the back of an envelope, and gets shipped more often, because when a result is small enough to verify by hand, people verify the algebra and forget to verify the input.
Two assets. Volatilities of 10 and 20 percent, expected returns of 8 and 12 percent. Set the correlation to minus one and ask for the minimum-variance combination. The answer is two thirds in the first asset and one third in the second, and its variance is exactly zero, the two volatility contributions cancel term for term. Expected return on that riskless portfolio: 9.33 percent.
Every step is correct. Variance is a convex function of the weight, so the critical point is global; there is no local-optimum trap and nothing to double-check. The number is real, in the sense that it follows from the inputs. What it is not is a portfolio.
What a zero-variance portfolio is actually asserting
Problem in one line: at correlation exactly −1 the algebra hands a two-asset portfolio with no variance and a 9.33% return, not a portfolio, an arbitrage claim the risk-free rate contradicts.
| Lab (σ 10% & 20%, μ 8% & 12%) | Construction | Reading |
|---|---|---|
| ρ = −1, zero-var mix | Long/short mix then σ=0, E[r]≈9.33% | 533 bp riskless excess if r_f=4%, refuse as arb claim |
| ρ = +1 with shorts | 200% / −100% then σ=0, E[r]≈4% | Lands on r_f; still not a free lunch, still singular |
| Estimated ρ clipped to −1 | Spreadsheet “finds” zero risk | Estimation artefact, not discovery |
| CEH dual frames forced ρ=−1 | Invented perfect hedge of 1.50 vs 2.10 | Deny; dual marks are not perfect offsets |
If a combination of traded assets has zero variance, it is a synthetic risk-free instrument. Its return must equal the risk-free rate. If it does not, you have not found a portfolio, you have found an arbitrage: positive gain, zero net investment, no risk.
So put the risk-free rate next to the output. Call it 4 percent. The construction claims 9.33 percent with certainty, 533 basis points of riskless excess return, in listed size, from two names and a spreadsheet. Stated that way nobody signs it. Stated as "the optimiser found a minimum-variance portfolio at 9.33 percent expected return," it goes in the deck.
The mirror case says the same thing in different clothes. At correlation plus one, zero variance is still reachable, but only with shorts: 200 percent of the first asset against 100 percent short of the second, 300 percent gross. Its expected return lands on 4 percent here, exactly the risk-free rate, which is the arithmetic being polite. Perturb the inputs and it stops matching, and the moment it stops matching you are claiming free money again, now with three times the gross and a borrow requirement.
The general rule I would put on the card: any construction whose modelled variance rounds to zero must be tested against the risk-free rate, and a gap between the two is an arbitrage claim requiring the evidence an arbitrage claim deserves, which, on liquid equities and a two-name portfolio, is roughly "no."
Why the estimate can never justify it
The correlation in that calculation is not a fact. It is an estimate, and the sensitivity of the answer to it is at its maximum precisely where the answer is prettiest.
Hold the weights at two thirds and one third and vary the correlation. At minus one, volatility is 0.00 percent. At minus 0.97 it is 1.63 percent. At minus 0.90 it is 2.98 percent. Under a stress week that takes the pair to minus 0.50, it is 6.67 percent. The "riskless" portfolio's volatility is a steep function of a parameter nobody hedges and everybody estimates.
Now add the estimation uncertainty properly. A correlation estimate cannot use a plain normal-approximation confidence interval near the boundary: correlation is squeezed into [-1, 1], so its sampling error is not symmetric or constant the way a mean's is, it gets tighter as the true correlation approaches -1 or +1. The standard fix is the Fisher transform: map the correlation through z = arctanh(rho), build a plain symmetric interval on that unbounded z-scale using standard error roughly 1/sqrt(n-3), then map the interval's endpoints back through tanh to return to correlation space. Suppose the sample correlation from sixty monthly observations comes in at minus 0.97. A Fisher-transform interval at one standard error runs from about minus 0.977 to minus 0.961, a tight band, because correlation estimates near the boundary are precise in correlation space. Translate that band into volatility and it runs from 1.43 percent to 1.86 percent.
That is the whole argument in two numbers. The risk estimate has a ±13 percent relative band around it, and zero is not in the band. It cannot be, because minus one is a boundary the estimator reaches only in a degenerate sample. So the zero-risk portfolio is not a portfolio you have evidence for and might be slightly wrong about. It is a portfolio your own data actively rules out, replaced by one that carries somewhere near 1.6 percent volatility with hundreds of percent of implied use sitting behind it.
Why it feels like a discovery rather than a bug
Because it is the one case in portfolio mathematics where the answer is exact and the intuition is satisfying. Perfect negative correlation genuinely does cancel risk, and the two-asset mean-standard-deviation diagram where the frontier collapses to two straight segments meeting the vertical axis at zero is the clearest picture in the subject. Excellent teaching object, excellent unit-test fixture, you know the answer in closed form.
The trouble starts when a fixture escapes into a pipeline. Nothing in the code distinguishes "correlation is minus one because this is the synthetic test case" from "correlation is minus one because a join produced two copies of one series with a sign flip." Both produce a zero, only one is a bug, and it is the one that looks like alpha. Unlike the rank-deficiency story, this failure survives scrutiny by careful people, because the algebra is checkable and gets checked. The unchecked step is the correlation input, which arrived as a float from an estimator nobody opened.
How this shows up in production
- Fixture leakage. A hand-set correlation of minus one ends up in a config, a default, or the fallback path that fires when the estimator has insufficient data. The zero-risk portfolio is now a production output of a missing-data branch.
- Duplicated series with opposite sign. A hedge leg and its underlying, or a long and a short book entry, loaded as two instruments. Estimated correlation is minus one to within rounding, and the optimiser finds it instantly.
- Rounding and clipping at the boundary. Estimates stored at two decimals turn minus 0.995 into minus 1.00, and matrices repaired by clipping entries into range land on exactly plus or minus one. Both moves happen in layers nobody thinks of as modelling decisions, and both convert a numerical tidy-up into a free-lunch generator.
- Zero-vol claims with no risk-free comparison. No stage compares an implied riskless return against the actual risk-free rate, so the arbitrage assertion never gets stated as one and therefore never gets refused.
A walkthrough on CEH-001
Same family, same two card-consistent marks near 1.50 and 2.10.
The hedge study pairs CEH-001 against a liquid proxy chosen precisely because it tracks the structure's dominant exposure. Marks for CEH-001 are constructed from the same curve the proxy is quoted off, so the two mark series are near mirror images by construction. The estimated correlation of the hedged pair comes back at minus 0.97, and after the correlation matrix is clipped and stored at two decimals it enters the optimiser as minus 1.00.
The output is a hedge ratio with zero modelled variance and a positive expected return, presented as a fully hedged position on a never-traded structure. Read that slowly: an instrument with no tape, whose mark is a construction, and the claim is that a two-leg portfolio of it carries no risk and beats the risk-free rate. The harness denies it, and the denial is not a judgement call, a live equity-linked promote resting on a perfect-correlation zero-volatility claim is refused categorically, the same way tomorrow's ten-year print is refused.
The recovered honest numbers are the interesting part. With the unclipped estimate the hedged pair carries roughly 1.6 percent volatility, with a one-standard-error band of 1.43 to 1.86 percent that excludes zero. Under a stress correlation the same position runs near 6.7 percent. And crucially: the hedge does not close the frame gap. CEH-001 still marks near 1.50 one way and 2.10 the other, because the gap is a convention-and-completeness question, not a variance question. A "perfect hedge" that appears to reconcile them is the strongest possible pressure toward 1.80, a mark justified by a position whose risk was an artefact of two decimal places.
What stacks quietly assume
They assume correlations are inputs rather than estimates, that a boundary value is a value like any other, that clipping and rounding are cosmetic, and that a zero-variance result is an achievement rather than a contradiction. They assume convexity means correctness, it guarantees the critical point is global and guarantees nothing about the inputs. And they assume a hedge that flatters the risk number is evidence about the world, rather than evidence about the machinery that produced both series.
What a solution must do
Problem: perfect correlation (±1) produces zero-variance portfolios that look like discoveries and are estimation or clipping artefacts. Solution: bound |ρ| away from 1 in the card, refuse zero-vol books unless they pass an economic arb test against r_f, and never treat dual CEH marks as perfectly offsetting hedges.
What to lock
- Correlation clip bounds (e.g. |ρ| ≤ 0.95) are card fields on Σ construction.
- Any portfolio with model σ below a floor and E[r] ≠ r_f escalates as
PHANTOM_ARB. - Research decks cannot promote “zero risk” without KKT + PD/Σ gates + r_f consistency.
- CEH: 1.50 vs 2.10 is dual-frame risk, not a ρ=−1 closed hedge.
- Agents may propose hedges; harness refuses perfect-correlation free lunches.
Clearance coupling: algebra that contradicts the risk-free rate is not alpha. Next: frontier hash (S2-10), promote the near-optimal set, not a trophy point.