Every system that uses the framework of this book operates on a daily cycle - what we will call the Daily Alpha Closure. The cycle has six phases, each one a direct application of the chapters in the preceding parts. Together, the six phases close the loop between prediction (what the system thought would happen), action (what it actually did), outcome (what really happened), and learning (how it adjusts itself for tomorrow). The closed-loop discipline is what separates a trading system from a trading idea. An idea predicts; a system predicts, acts, measures, and learns - and does it again every single day.
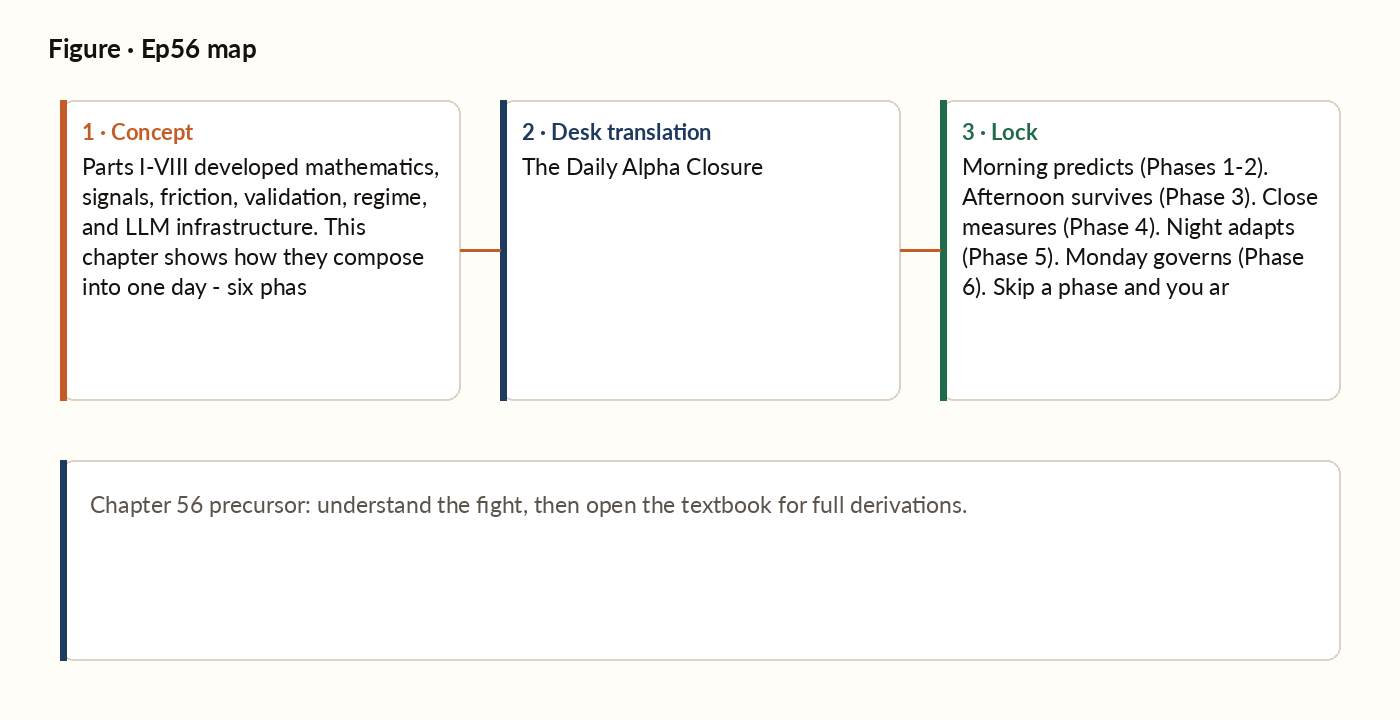
Figure 1. Concept map for this episode: fight, desk translation, what to lock.
Master map — six phases × book chapters
Read this table first; each phase below expands the same rows. Governance layers (all phases): cross-phase invariants (the plan, once committed, is immutable and every version is persisted for audit); mid-week pause triggers that halt the loop early if the convergence card fires before Monday's review.
Phase 1: Pre-market preparation
Time: roughly two hours before the local market open. Run by automation; no operator intervention needed. Inputs: yesterday's close prices, overnight news feed, today's economic calendar, friction governor settings, current Brier-calibration status.
Phase 2: Execution
Time: market open through morning session. Run by execution engine; operator monitors but does not interfere.
Phase 3: Intraday risk management
Time: through the trading day. Run by automation, with continuous checks running underneath every position: the day's running loss against its circuit-breaker limit, volatility against each stop's planned distance, and exposure against sector and theme concentration limits. Breach any of them and the system halts new entries automatically; positions already open still manage out per their pre-defined stop, target, and time-stop rules.
Phase 4: End-of-day reconciliation
Time: after market close. Run by automation; operator reviews. 1. Position reconciliation. The broker's reported positions are compared to the system's expected positions. Any mismatch is logged for investigation. 2. Trade journaling. Every closed trade is recorded with entry, exit, P/L, friction, triple-barrier outcome, and the features that were live at entry.
Phase 5: Overnight learning
Time: 21:00 to 04:00. Run by automation; results visible to the operator the next morning. The system re-checks which features are still earning their keep, re-estimates how much genuinely independent signal the feature panel carries, sanity-checks the day's results for hidden autocorrelation, recalibrates its probability estimates if they have drifted, and adjusts tomorrow's position sizing and friction assumptions accordingly.
Phase 6: Weekly review
Time: Monday morning. Operator-driven. Each strategy's convergence status is reviewed, and any strategy that has failed is paused immediately. Pipeline health is checked separately from P/L, because a system can look profitable while quietly breaking underneath. The feature panel, calibration, and risk budget are all audited, and any promotion from paper testing to live capital is confirmed only against real cash results, never simulation alone.
Definition
A trade plan is a complete pre-commitment to a set of actions and their justifications. For each candidate trade it specifies: the ticker, the side (long or short), the entry price (or order type), the stop price, the target price, the position size in shares and in R-multiples, and the source features and probabilities that justified the trade. The plan is immutable once committed: no element is changed during execution. This immutability is what makes the after-the-fact reconciliation possible - every realised outcome can be matched back to the prediction that justified it.
Worked picture
At end of day, the reconciliation produces entries like: - ABC: predicted P(win) = 0.62, realised outcome = win, R = +2.1. Brier contribution: 0.144. - DEF: predicted P(win) = 0.58, realised outcome = loss, R = -1.0. Brier contribution: 0.336. - GHI: predicted P(win) = 0.71, realised outcome = win, R = +1.4. Brier contribution: 0.084. Each entry is a self-grading data point. Over weeks, the cumulative Brier score reveals whether the model's probabilities are well-calibrated. The convergence card aggregates the R-multiples into the running mean and standard error. Tomorrow's sizing decisions are informed by these aggregates, which are informed by today's reconciliations, which are informed by today's executions, which were informed by yesterday's plan. This is the closed loop, made concrete.
What breaks in production
The temptation to lift the offer when a limit order does not fill is enormous. The trade was a good idea; the price has moved a little; if you just pay the extra few cents you can still get the position on. The math says otherwise. Your EV calculation included the friction at the planned entry price. If the price has moved, the new friction is higher. If the new friction reduces EV below the no-trade threshold, the trade should be cancelled - not chased. Chasing converts a planned positive-EV trade into an unplanned negative-EV one. The discipline: pre-define, in the trade plan itself, the maximum slippage allowable before the trade is abandoned. Honour the rule even when it feels frustrating. Frustrated abandonments are still EV-positive; chased fills often are not.
One day, one loop
Morning predicts (Phases 1-2). Afternoon survives (Phase 3). Close measures (Phase 4). Night adapts (Phase 5). Monday governs (Phase 6). Skip a phase and you are open-loop on that timescale.