A backtest tells you what did happen on the one historical path the world actually took. A Monte Carlo simulation tells you what could happen - the range of outcomes the strategy might produce in alternative realisations of the same underlying process. The backtest is one sample from the distribution; Monte Carlo gives you a sense of the distribution itself. This chapter develops Monte Carlo for strategy evaluation: the basic procedure, the choice of simulation design, and the distributional statistics that turn a single backtest into a probabilistic forecast.
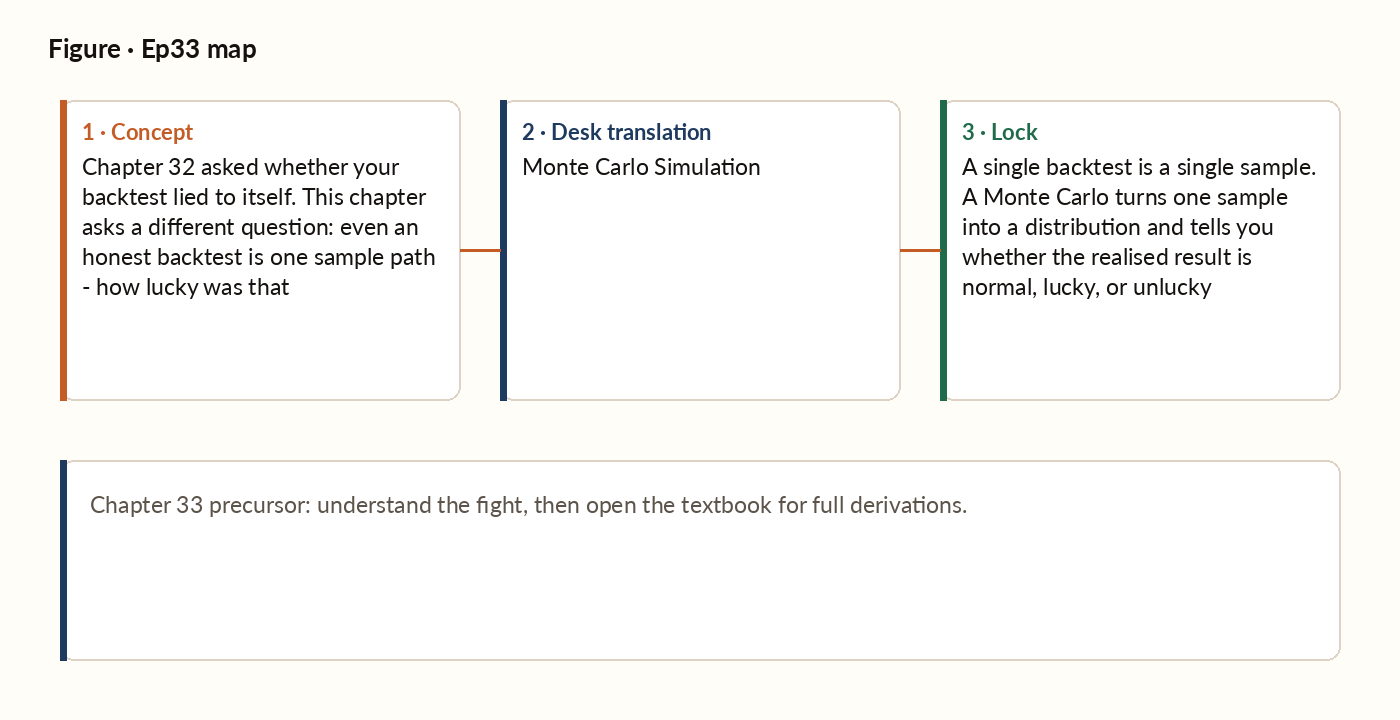
Figure 1. Concept map for this episode: fight, desk translation, what to lock.
Why one number is not enough
Suppose your backtest reports a Sharpe of 1.5 over a five-year window. What does this single number tell you? It tells you what one possible path of history looked like. The same strategy, with the same true edge, could have produced Sharpe 0.8 in a slightly different five years, or Sharpe 2.2, depending on the order in which winning and losing streaks fell. A point estimate without a distribution is missing the most important piece of information: how lucky did we get?
The basic Monte Carlo for a binary-outcome strategy
The simplest Monte Carlo, used when trades are roughly independent and binary: 1. From the backtest, estimate the strategy's win rate and the per-trade R-multiple distribution (the value of for wins and for losses). 2. Simulate thousands of alternative paths of the same length. For each trade in each path, sample a win or loss according to the estimated win rate, and an R-multiple from the observed distribution. Then compute the cumulative P&L of each path and report the distribution of final outcomes - the median, the 5th and 95th percentiles, and the distribution of maximum drawdown. The result is a probabilistic statement: in most simulated futures with this strategy's underlying edge, annual return and drawdown fall within a predictable range.
Choosing the right Monte Carlo design
The simulation design must match what you want to know. Three common choices: Independent Bernoulli (described in §33.2). Useful when trades are roughly independent. Fast and simple. Underestimates risk if trades are clustered in time - e.g., if all your strategies tend to lose during volatility spikes, simulating independent trades misses that systemic concentration. Block bootstrap: re-sample contiguous blocks of historical trades instead of individual trades, preserving the local correlations within each block. This captures regime-dependent clustering better than independent draws, and is the standard choice for autocorrelated trade series.
What to report from a Monte Carlo
The single number "median final P&L" is incomplete. A useful Monte Carlo report includes: - Median, 5th, 25th, 75th, 95th percentile of annual returns. - Distribution of maximum drawdown (median and worst 5%). - Probability of negative annual return. - Probability of breaching a specified drawdown threshold (e.g., probability of any 20%+ drawdown over the simulation horizon). - Expected time spent in drawdown. - Distribution of the longest losing streak. Together, these give a complete picture of risk - the kind of picture a serious capital allocator demands before committing capital to a new strategy.
Worked picture
A strategy has a true win rate of 55%, with R = +1 on wins and -1 on losses. You ran a 100-trade backtest and observed 58 wins, 42 losses, ending at +16R. Was the strategy lucky or unlucky? Run a Monte Carlo: simulate 10,000 alternative paths of 100 trades each, each trade winning with probability 0.55. Compute the final P&L of each path. Results: median final P&L is about +10R. 5th percentile is about -6R, 95th percentile is about +26R. Probability of a negative final P&L is about 13.5%. Your realised +16R is above the median but well within the central 90% - neither remarkable luck nor remarkable misfortune. The strategy's true expectation is roughly +10R per 100 trades; your sample landed slightly above. Crucially, you now know that even a strategy with a real edge produces a negative 100-trade result more than one time in eight. That is the noise floor you must mentally subtract before judging any realised result.
What breaks in production
Real trading strategies experience streaks. A momentum strategy in a strong trend wins many trades in a row; the same strategy in a choppy market loses many in a row. If you simulate by drawing each trade independently, you generate paths that are too smooth - the simulated drawdowns are smaller than the drawdowns you will actually experience. The fix is the block bootstrap or a regime-aware Monte Carlo. For any strategy whose trades are not provably independent (which is almost all of them), the independent Bernoulli should be treated as an optimistic lower bound on the true drawdown distribution.
Key idea
A single backtest is a single sample. A Monte Carlo turns one sample into a distribution and tells you whether the realised result is normal, lucky, or unlucky relative to the strategy's true edge. Without it, you cannot tell skill from variance.