A traditional text representation is a bag of words: a vector with one position per word in the vocabulary, where each entry is 1 if the word appears in the document and 0 otherwise. For a 50,000-word vocabulary, every document is a 50,000-dimensional mostly-zero vector. Documents that share no words have zero overlap - even if they mean exactly the same thing. Embeddings replace this with a dense representation: a 384- or 1536-dimensional vector where every entry is a small real number, and similar meanings produce similar vectors. "Q3 earnings beat estimates" and "Strong Q3 results topped expectations" share no words but have nearly identical embeddings, because the embedding model learned during training that these two phrases convey the same information.
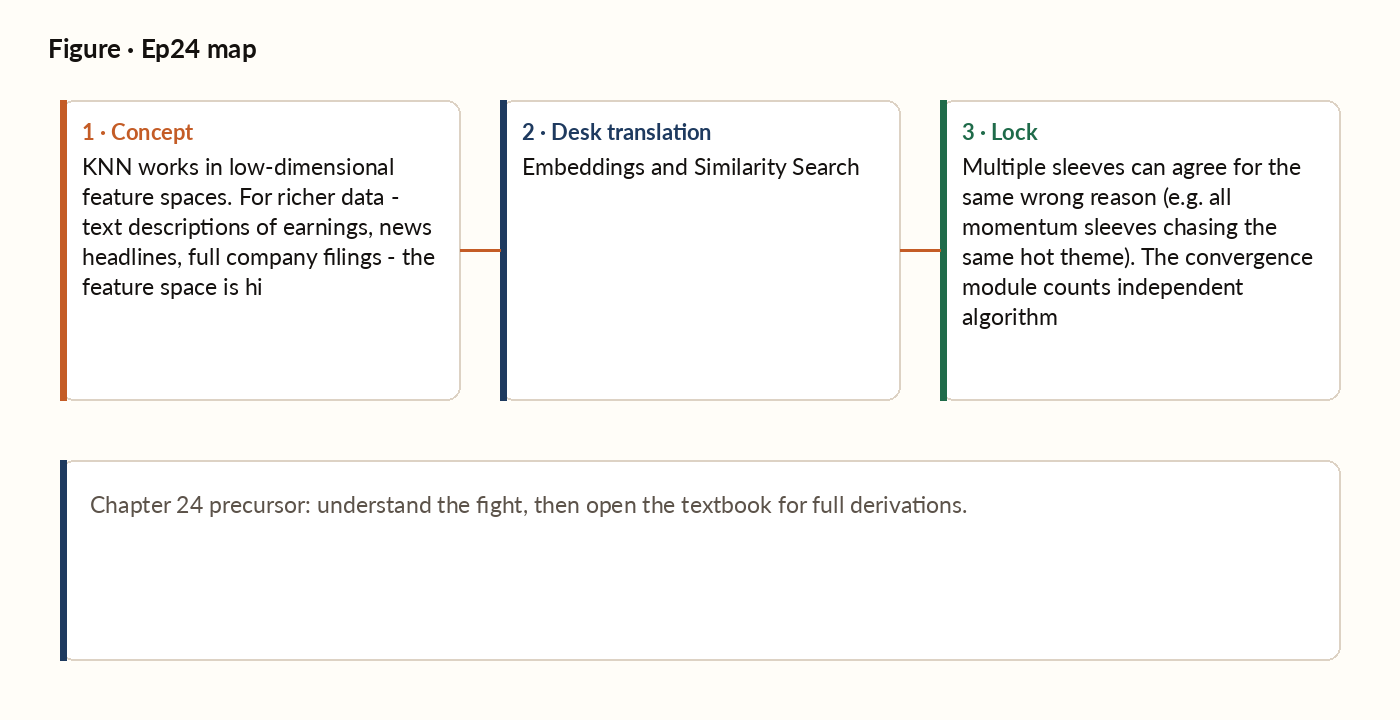
Figure 1. Concept map for this episode: fight, desk translation, what to lock.
What an embedding is
An embedding is a function that maps an input from some complex space (text, image, audio) to a dense real-valued vector, typically somewhere between 384 and 1536 numbers long depending on the model. The key property: semantically similar inputs map to nearby points in the embedding space. For text, a sentence like "Strong Q3 earnings, raised guidance" should embed near "Q3 results beat estimates and outlook raised" - they mean roughly the same thing. The two sentences may share few words, but their embeddings should be close in cosine distance.
Why embeddings matter for trading
In trading, embeddings open up several previously-difficult use cases: News and earnings classification. Embed each news headline; cluster similar headlines; track which clusters are predictive of returns. This finds catalysts that are not captured by simple keyword matching.
The similarity search infrastructure
Once you have an embedding model, the operational pattern is: 1. Index. For each historical document (news headline, earnings transcript, etc.), compute its embedding once and store it. 2. Query. Given a new document, compute its embedding, then search the index for the nearest historical embeddings by cosine similarity. 3. Aggregate. Look at the historical outcomes (e.g. returns over the subsequent week) of the retrieved documents and combine them into a single feature.
Cosine similarity vs Euclidean
For embeddings, the standard similarity metric is cosine similarity, which measures the angle between two vectors rather than their distance. It ranges from -1 (pointing in opposite directions) to +1 (pointing in the identical direction). It ignores magnitude and considers only the direction of the vectors - a useful property because magnitudes in embedding space often encode irrelevant scaling information.
Worked picture
A trading shop embeds 100,000 historical news headlines using an open-source sentence encoder. They use k-means to cluster the embeddings into 50 thematic clusters. For each cluster, they compute the average return of the mentioned stock over the 1, 5, and 20 trading days after the headline appeared. Three of the 50 clusters show statistically significant positive abnormal returns. One cluster is "guidance raises"; one is "deal announcements with strategic premium"; one is "product launches with analyst upgrades." In production: every new headline is embedded, classified into a cluster, and the cluster's historical abnormal-return profile becomes a feature in the alpha combination. The system has automatically discovered three durable catalysts without anyone hand-engineering keyword lists. Three years later, the operator runs the same analysis and finds the third cluster's edge has decayed (other systems are now harvesting it). The cluster is dropped from the panel; the first two remain in production.
What breaks in production
A frequent mistake: interpreting cosine similarity as a probability. "This news headline has 0.85 cosine similarity with the bullish cluster, so it's 85% likely to be bullish." Cosine similarity is not a probability. It is a geometric measure of vector alignment in embedding space, ranging from -1 to +1. The relationship between cosine similarity and any meaningful trading probability is empirical and must be calibrated - typically via isotonic regression (Chapter 10) mapping cosine to historical hit rate. Without calibration, the cosine similarity is a score that may correlate with the outcome but is not a probability. Using it directly in the Bayesian Kelly machinery will produce dangerously over-confident sizing.
Embeddings are geometry, not probability
Cosine similarity tells you how close two ideas sit in the model's dense vector space - it is not a hit rate, and it does not skip the usual gates. A cluster of similar headlines still has to earn its place: it needs a real, statistically significant edge, it needs to survive the same checks as any other feature, and it needs a track record before real capital follows it. Structured features still carry most of the signal; embeddings are best at catching the catalysts that hand-built keyword rules miss.