This chapter develops logistic regression from first principles, explains why it is the canonical model for probability scorecards, and connects the output back to the Bayesian Kelly sizing of Chapter 9. A linear regression model produces an output that can be any number at all, unbounded in either direction. That's fine for predicting returns, but disastrous for predicting probabilities, which must stay between 0 and 1.
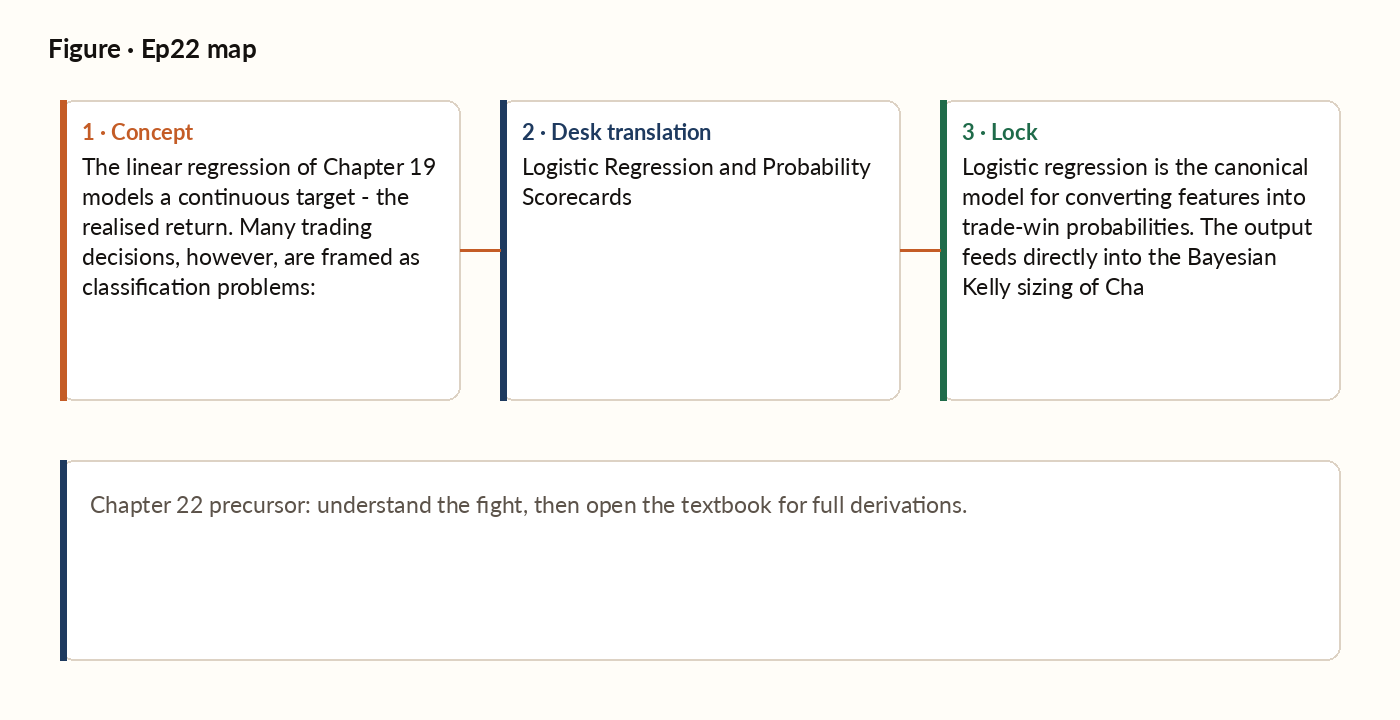
Figure 1. Concept map for this episode: fight, desk translation, what to lock.
The link function
The logistic regression model fixes this by passing the linear combination of features through a sigmoid curve, which squashes any real number smoothly into that 0-to-1 range - so the model's raw score always comes out as a valid probability.
Fitting by maximum likelihood
Logistic regression is fit by maximum likelihood rather than least squares: instead of minimising squared errors, the fitting procedure searches for the coefficients that make the observed win/lose outcomes most probable under the model.
Interpreting the coefficients
In linear regression, a coefficient is the change in the outcome per unit change in the feature. In logistic regression, a coefficient is the change in log-odds per unit change in the feature - a less intuitive scale, so most quantitative shops convert it to an odds ratio instead: the multiplicative change in odds per unit increase in the feature. For example, a coefficient of 0.5 means a one-unit increase in that feature multiplies the odds of winning by about 1.65. If the baseline odds were even (a 50% chance), after that increase the odds become roughly 1.65-to-1, or about a 62% chance.
The probability scorecard
A logistic regression fit on a feature panel and a binary "trade wins?" outcome produces a probability scorecard - a model that takes the current feature values for a candidate trade and outputs a calibrated win probability. This is exactly the input the Bayesian Kelly machinery from Chapter 9 needs.
Worked picture
Features: standardised momentum and standardised volume spike, with fitted coefficients that turn a candidate trade with momentum one standard deviation above normal and volume spike two standard deviations above normal into an estimated win probability of 0.574. With a 1:1 payoff, the Kelly bet (Chapter 8) would be about 14.8% of capital - before applying fractional-Kelly scaling, variance shrinkage, and the hard cap. The model's baseline reflects that the average trade has a slightly below-50% raw win rate (because of friction), while the positive coefficients on momentum and volume spike reflect that these features improve the odds.
What breaks in production
Logistic regression with L2 (ridge) regularisation handles correlated features by shrinking their coefficients toward zero. A side effect: a feature that has lost its edge will quietly receive a smaller coefficient at each re-fit, but it remains in the model. The composite alpha looks fine; the model "still works." But the dead feature is still being computed at inference time, costing infrastructure and risk-management attention. Worse, when the model is next re-fit, the dead feature's small coefficient may bounce around with noise - a sign that the feature is no longer earning its place. The fix: combine L2 with periodic feature-significance review (Chapter 15 applied to the logistic-regression coefficients). Features whose t-statistics have been insignificant for two consecutive re-fits should be deprecated. L2 alone is too lenient; it tolerates dead features rather than removing them.
Key idea
Logistic regression is the canonical model for converting features into trade-win probabilities. The output feeds directly into the Bayesian Kelly sizing of Chapter 9. The discipline that makes a logistic scorecard reliable in production is not the model itself but the surrounding machinery: weekly Brier calibration check, monthly re-fit on rolling windows, isotonic calibration layer, feature-significance review at each re-fit. The scorecard without the discipline is a curiosity; the scorecard with the discipline is a working trading system's brain.