The Sharpe ratio, introduced by William Sharpe in 1966, is the single most-cited risk-adjusted return statistic in finance. It is a signal-to-noise ratio: your strategy's average return above the risk-free rate, divided by how much that return bounces around. A Sharpe of 1.0 is respectable but not extraordinary for a long-only equity strategy; a Sharpe of 2.0 is well into excellent territory; a Sharpe above 3.0 sustained over multiple years is rare and almost always either statistical noise, hidden leverage, or fraud.
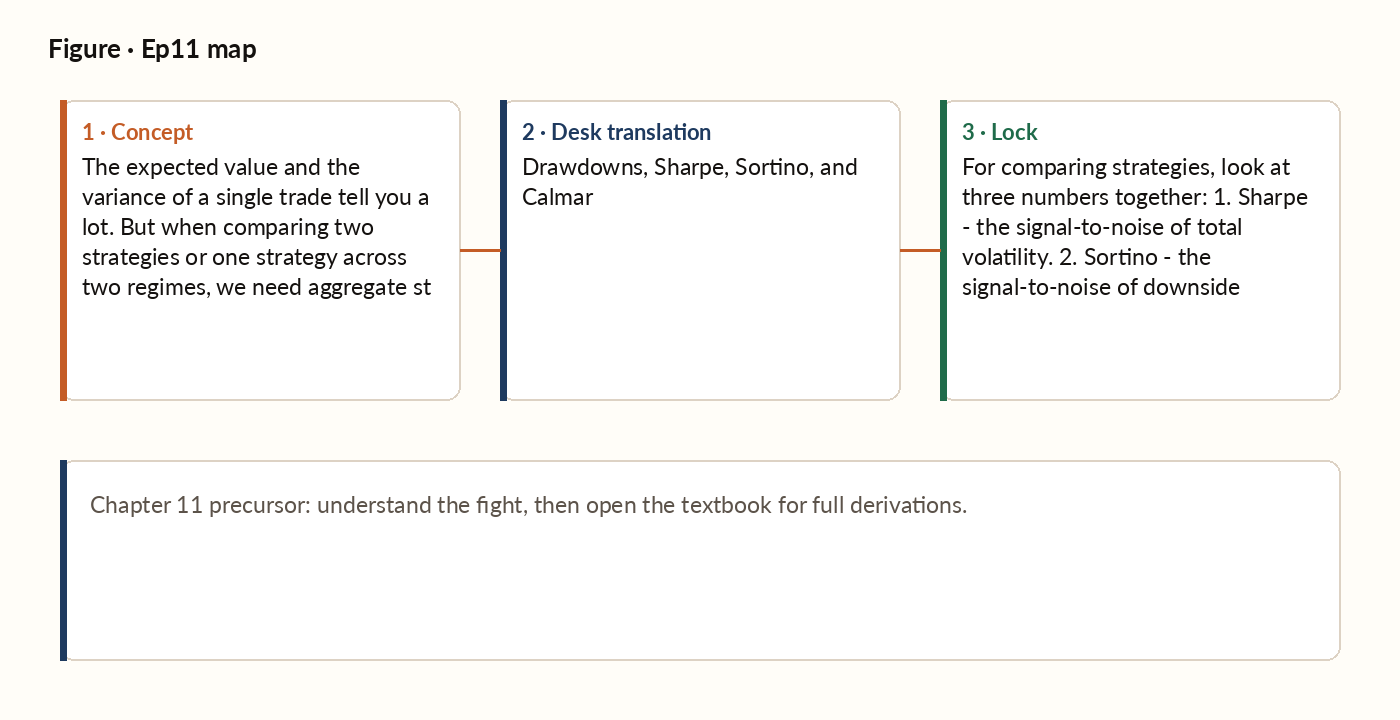
Figure 1. Concept map for this episode: fight, desk translation, what to lock.
The Sharpe ratio
The Sharpe ratio is directly connected to something concrete: the higher it is, the faster your edge becomes statistically visible, and the higher the probability you've actually made money by any given point in time rather than just gotten lucky (or unlucky).
Annualising the Sharpe ratio
The Sharpe ratio is conventionally reported on an annualised basis. To convert a per-trade Sharpe to annual Sharpe, multiply by the square root of the number of trades per year. For a strategy firing 250 trades a year, the annualised Sharpe is roughly 15.8 times the per-trade Sharpe. For a strategy firing only 5 trades a year, the annualised multiplier is a much smaller 2.2. This is why higher-frequency strategies show higher annual Sharpe ratios for the same per-trade edge. The same square-root-of-N scaling that shows up throughout this book.
The flaws of Sharpe
It penalises upside volatility as much as downside volatility. A strategy that has long quiet stretches punctuated by occasional huge wins has a high standard deviation and therefore a low Sharpe. Even though "volatility to the upside" is not what investors fear. It also assumes returns are roughly normally distributed, which understates tail risk for the fat-tailed distributions that characterise essentially every real strategy, and it can be gamed: a strategy that sells deep out-of-the-money options collects a steady stream of small premiums and shows an excellent Sharpe right up until the rare catastrophic loss arrives.
The Sortino ratio
The Sortino ratio addresses the first flaw of Sharpe (penalising upside volatility) by replacing the standard deviation with the downside deviation. A measure of spread computed only over the losing periods, ignoring how much the winners vary. A strategy with only positive outliers (rare large wins, no large losses) has a low downside deviation and therefore a high Sortino. Even if its standard-deviation-based Sharpe is mediocre. Sortino is therefore preferred when comparing strategies whose return distributions are asymmetric.
Worked picture
Three strategies: Strategy A trades 200 times a year with a modest per-trade edge, giving an annual Sharpe of about 1.88. Strategy B trades only 30 times a year but with a much larger per-trade edge, giving an annual Sharpe of about 1.37. Strategy C trades a rapid 2,000 times a year with a tiny per-trade edge, but ends up with the best annual Sharpe of the three, about 2.24. Ranked by per-trade edge alone, B beats A beats C. Ranked by annual Sharpe, the order flips: C beats A beats B. Strategy C, despite having the smallest per-trade edge, dominates on a risk-adjusted annual basis purely because of its trading frequency. The square-root rule is doing the heavy lifting.
What breaks in production
Many published Sharpe ratios from hedge funds, mutual funds, and (especially) retail-marketing materials are computed over a short window during which the strategy happened to perform well. A strategy with a 24-month Sharpe of 2.5 may have a 60-month Sharpe of 0.8 once the full cycle is included. Worse, the uncertainty on a Sharpe ratio computed from a short data window is large. A 24-month Sharpe of 2.5 can easily have a 95% confidence interval of roughly 1.7 to 3.3 -- a headline number that could plausibly be a third smaller than reported. Be deeply suspicious of short-window Sharpe claims.
The triple-S framework
For comparing strategies, look at three numbers together: 1. Sharpe, the signal-to-noise of total volatility. 2. Sortino, the signal-to-noise of downside volatility (rewards asymmetric upside). 3. Calmar, the trade-off of mean return against worst-case drawdown. A strategy that scores well on all three is robust. A strategy that scores well on Sharpe but poorly on Calmar is hiding tail risk. A strategy that scores well on Sortino but poorly on Sharpe has an asymmetric return distribution worth understanding. No single number captures everything; always look at all three.