If you lose 50% of your capital, you must subsequently gain 100% just to break even. If you lose 75%, you must gain 300%. If you lose 90%, you must gain 900%. This compounding asymmetry - known formally as the gambler's ruin problem - is what destroys overconfident traders even when their underlying edge is genuine. This chapter develops the mathematics of ruin, computes the probability of being wiped out for several common position-sizing schemes, and explains why every professional risk manager in the world budgets first against ruin and only second against drawdown.
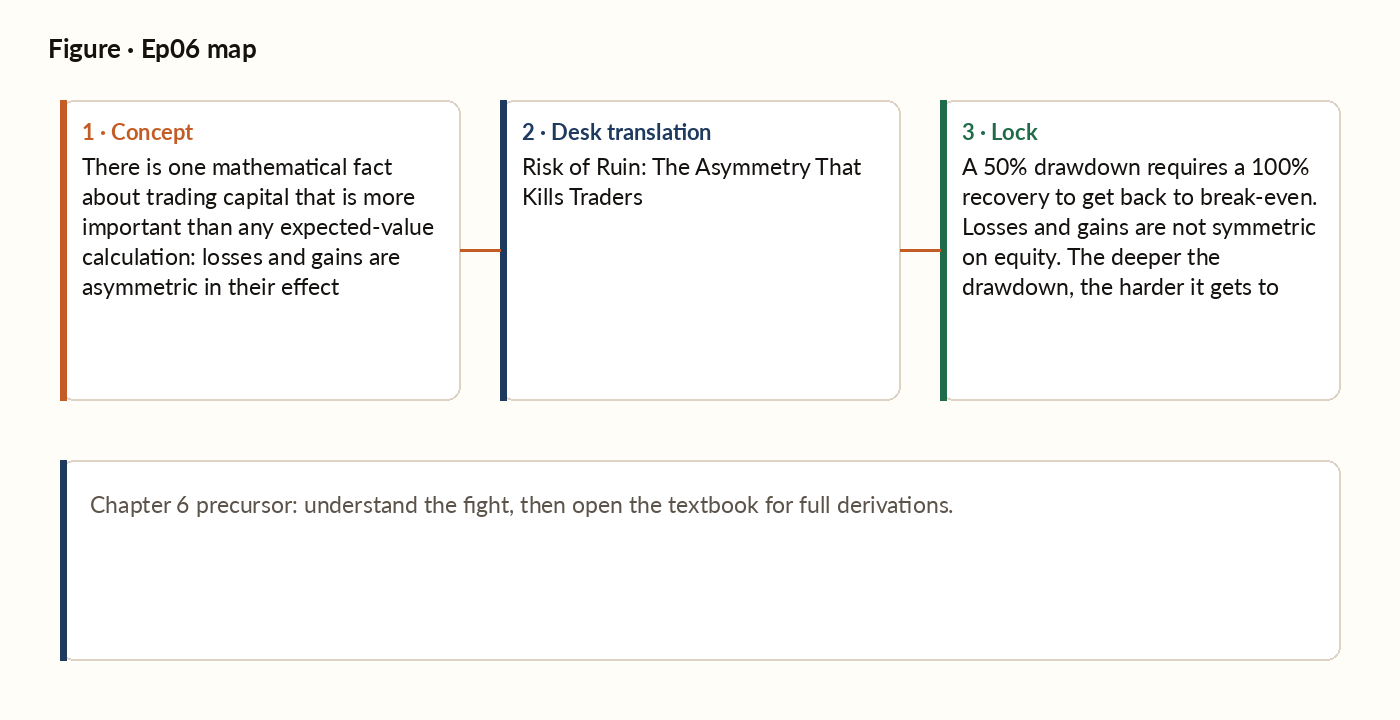
Figure 1. Concept map for this episode: fight, desk translation, what to lock.
The arithmetic of recovery
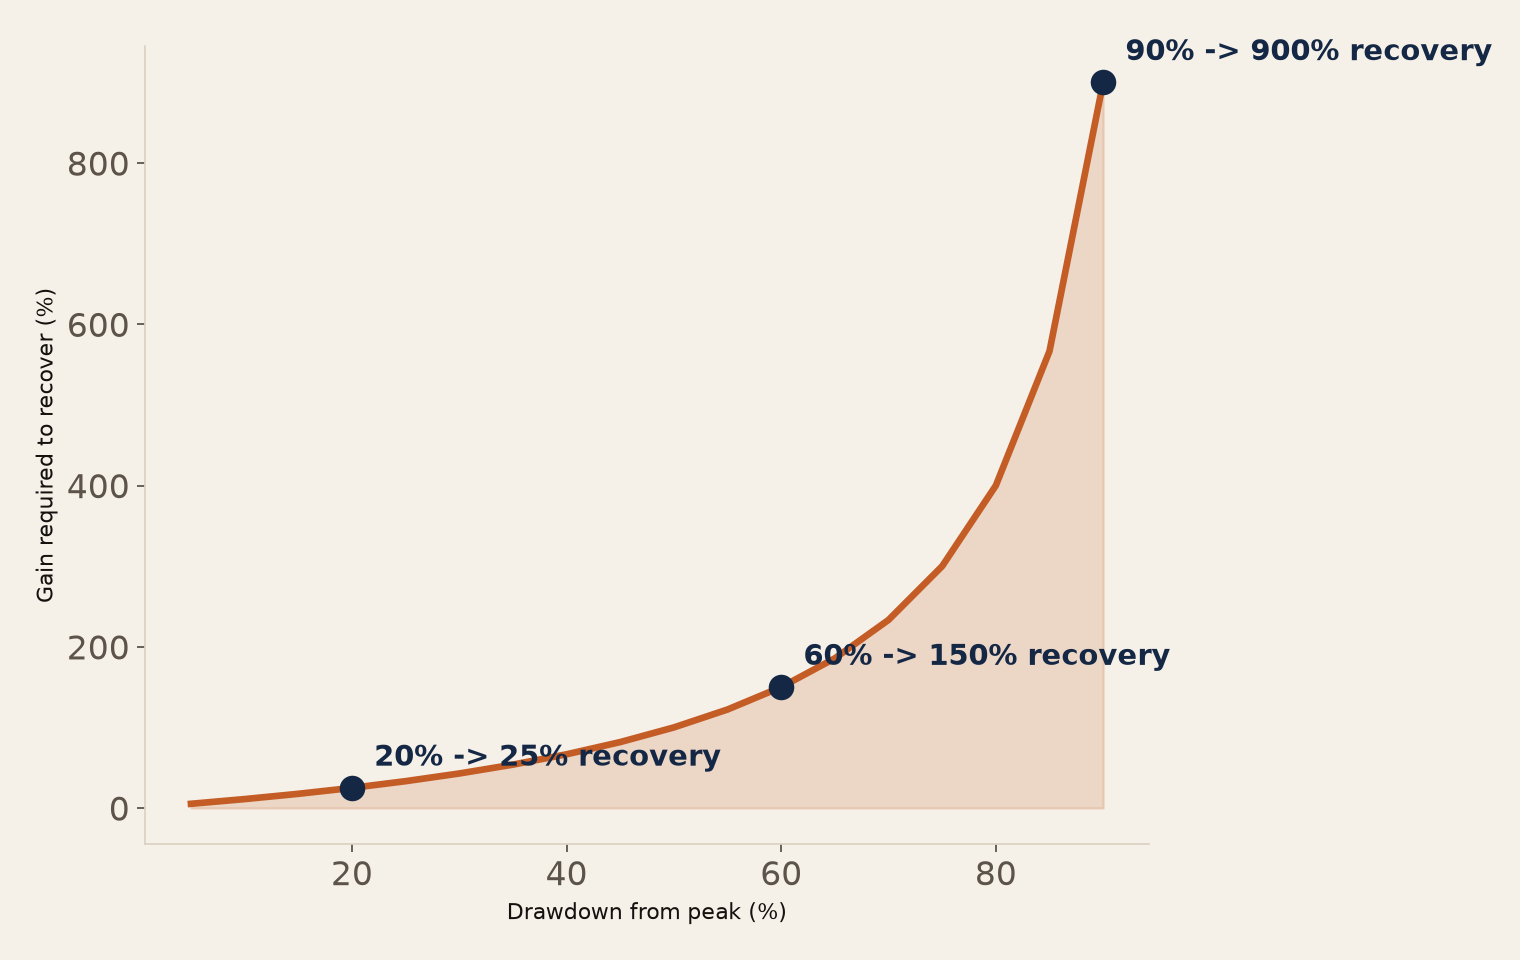
The relationship between a loss and the gain needed to recover from it is not symmetric, and it gets dramatically worse the deeper the loss: a 10% loss needs an 11.1% gain to recover, a 30% loss needs 42.9%, a 50% loss needs a full 100% gain, and a 90% loss needs a 900% gain just to get back to even.
The simplest ruin model
The simplest model of ruin assumes you bet a fixed fraction of your equity on each trade, win or lose. If your bet size is too large relative to your edge, your equity's expected long-run growth rate can turn negative even though each individual bet still favours you on average. The cutoff between growing and shrinking is called the Kelly fraction, which we will derive properly in Chapter 8. For now, the key insight is that betting more than the Kelly fraction guarantees ruin, even if your edge is positive. For example, with a 55% edge, a 10% bet size compounds positively, but doubling that bet size to 20% already turns the expected growth rate negative: the edge didn't vanish, the bet size turned log-wealth against you.
The classical gambler's ruin formula
A more careful treatment models your equity as a discrete-time random walk and asks: starting with some amount of capital, what is the probability that you hit zero before you hit some upper target? For a simple win/loss betting model, there is a closed-form formula for this probability of ruin, driven by your win probability and how far your starting capital sits from zero relative to your target.
What this means for capital allocation
The gambler's ruin formula has two important practical implications. First, even with a positive edge, you can be ruined with positive probability. With a 5% edge per bet and starting capital equal to one-tenth of your target, the probability of ruin works out to about 13.5%, not a rounding error but a real chance of going broke before you triple your capital.
Worked picture
A 40% loss requires a 66.7% rally just to break even. Starting equity ₹10 lakh drops to ₹6 lakh after the loss; you need to gain ₹4 lakh on a ₹6 lakh base. At a 0.15R net edge and 250 trades a year, the time to claw back depends on sizing and variance, but the arithmetic barrier is fixed: losses dig a hole whose rim rises as you fall.
Figure. Required recovery g = r/(1-r) — 20% down needs 25% back, 60% down needs 150%, 90% down needs 900%.
What breaks in production
A common mistake is treating per-trade variance as "risk." It is one component of risk, but it is not the most important one. The most important risk is the probability that you experience a drawdown so deep that you abandon the strategy. Two strategies with identical expected returns and identical per-trade variance can have very different maximum-drawdown profiles if their autocorrelations differ. A momentum strategy in a trending market has positive autocorrelation in returns (wins cluster after wins, losses cluster after losses), producing deeper drawdowns than a mean-reversion strategy with negative autocorrelation. The Newey-West correction (Chapter 16) and the autocorrelation diagnostics (Chapter 34) exist precisely to detect and price this kind of clustering.
The recovery asymmetry
A 50% drawdown requires a 100% recovery to get back to break-even. Losses and gains are not symmetric on equity. The deeper the drawdown, the harder it gets to recover, in a strongly nonlinear way. This is why professional risk management is built around maximum-drawdown limits, not around expected return targets. Once you breach a certain drawdown, even a great forward strategy cannot recover within reasonable timeframes.