Like a short physical law: edge lives in the distribution, not in today’s gut.
This series follows one running example the whole way through, a hypothetical trading account called North Desk. This book (Financial AI) covers the core betting math: what edge is, and why one trade never proves you have it. A companion book, Rulers Before Models, picks up the same North Desk example to cover a different question: how do you keep the model feeding it trade ideas honest and well-governed? Same account throughout, either way. In both, "the Forecaster" is our name for whatever is generating the trade ideas -- today, a language model alias such as sos-finma, served through inference software called vLLM, but never referred to by its raw model name so the underlying engine can change without anything else changing. This essay is the concept; the full chapter works through the actual numbers.
You cannot hand that desk a single P&L print, ask whether the sleeve has edge, and expect an honest unique answer. One outcome is compatible with almost any mild bias. Green feelings and red feelings both overclaim. That is not a motivational slogan. It is the Bernoulli structure of trading.
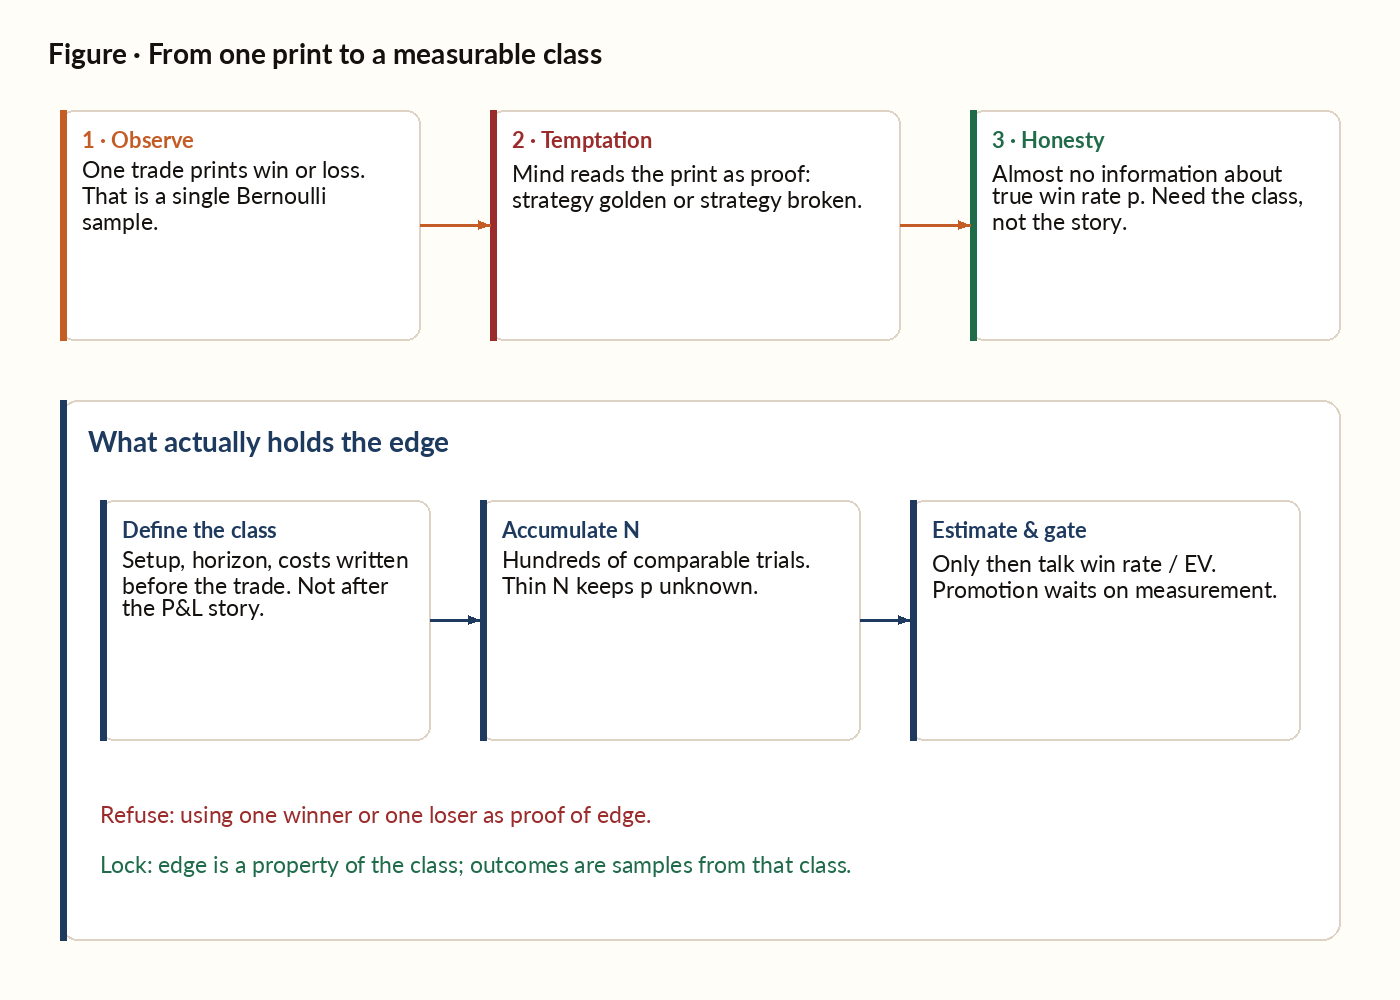
Figure 1. From one print to a measurable class. The left path is psychology. The right path is the only one that can certify edge.
The joke that hides the whole book
Two economists walk down a street. One spots a hundred-dollar bill and reaches for it. The other stops him: if it were real, someone would already have taken it.
The joke mocks naive efficient-markets faith. It also hides an uncomfortable truth this series works through carefully: whatever you can see on a screen, others can see; whatever edge you think you feel on one print is usually noise wearing a story.
And yet markets are not perfectly efficient. Small edges exist. They are not lottery tickets sold in tip culture. They look like a feature whose correlation with next-week returns is 0.04 instead of 0.00, or a setup whose true win rate is 55% instead of 50%. Real, small, and invisible on one trade.
This episode is about the gap between having an edge and feeling it. That gap is why systematic trading needs mathematics instead of conviction theatre. It is also why StokeOnStocks gates talk about classes, labeled outcomes, and sample size before they talk about “the model liked it.”
The biased coin (the simplest honest model)
This is the running example the whole series comes back to (Ep00 introduced it): a trading desk that only has to answer questions about a coin that isn't quite fair.
Let the probability of heads be p.
- If p = 0.5, the coin is fair: no edge.
- If p = 0.55, the coin is slightly biased toward heads: over a long run you expect about 55 heads in 100 flips.
Play even money. Stake 1 unit on heads. Win and you receive 2 back (net +1). Lose and you lose the 1 (net −1).
Fair game: edge = 0.
Positive edge: you expect to make money over many plays.
Negative edge: house advantage.
With p = 0.55 on even money, expected profit per flip is positive. Rough intuition for 100 flips: about 55 wins and 45 losses, net about +10 units, or 0.10 units per flip. That 0.10 is your edge on this game.
The crucial property: edge is invisible on a single trial.
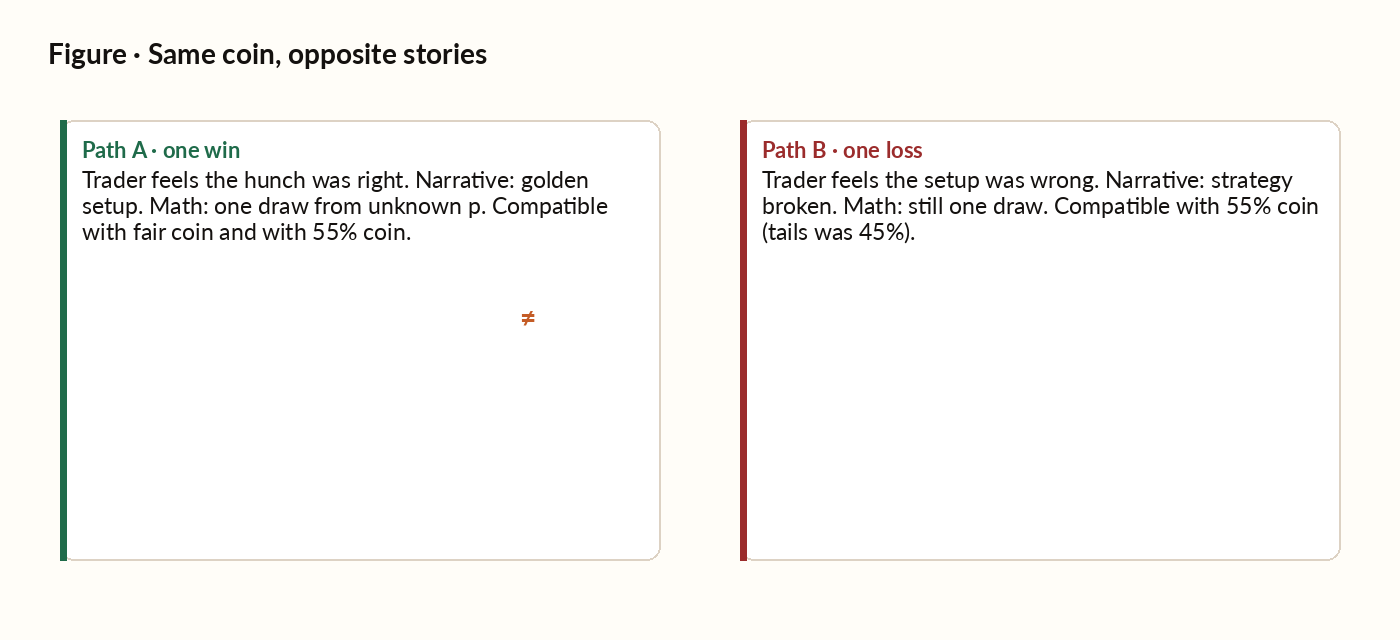
Figure 2. Same coin, opposite stories. One win and one loss are both almost silent about p.
What a single flip tells you
Flip the p = 0.55 coin once and get tails. What did you learn? Almost nothing. Tails had probability 0.45. A loss does not falsify the edge.
Flip once and get heads. What did you learn? Almost nothing again. Heads had probability 0.55, only slightly above a fair coin. A win does not confirm the edge either.
Stated about coins, this is obvious. Stated about trades, it is hard to live. The trader who stopped out on a high-quality setup feels the setup was wrong. The trader who doubled on a hunch feels the hunch was right. Both feelings are misleading. You saw one sample from each coin. One outcome from each tells you almost nothing about which coin you were flipping.
| What you saw | What it feels like | What it actually is |
|---|---|---|
| One win | “The strategy is golden” | One Bernoulli draw from unknown p |
| One loss | “The strategy is broken” | Same: almost no information about p |
| 12 wins in 20 trades | “60% win rate, ship it” | Wide uncertainty; true p might be 40% or 60% |
| Hundreds of trades | Less drama, more measurement | Where the class can finally speak |
How long until you can feel the edge?
This is the most important practical question in Part I. Later episodes (law of large numbers, CLT / √N) make it precise. For now, keep the order of magnitude and refuse small-N theatre.
Suppose your edge is about 0.10 units per unit risked on even money. After 100 flips, your average profit per flip is not exactly 0.10. It bounces. After 400 flips the bounce shrinks. After 1,600 it shrinks again. Uncertainty about the mean falls like 1 / √N. That is why “I took twenty trades and I’m up” is not a measurement of strategy quality.
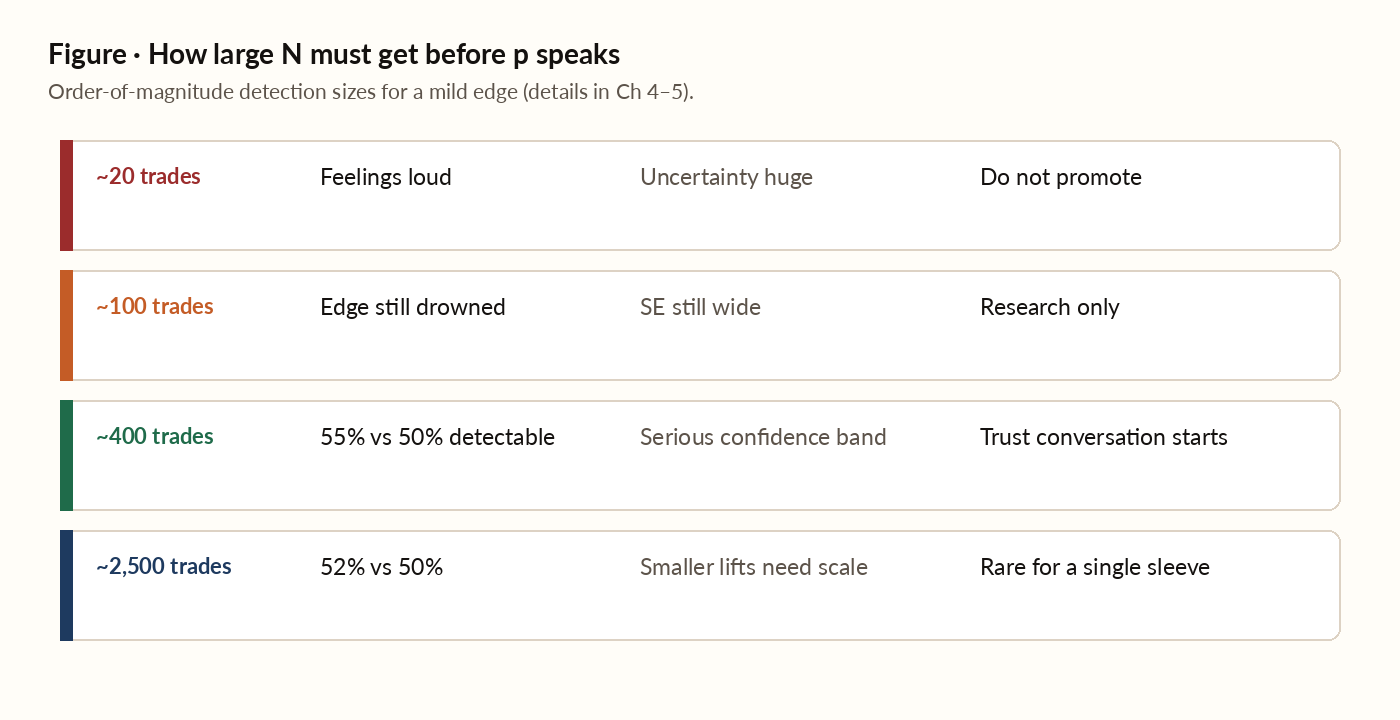
Figure 3. Sample size is the price of knowing p. Small edges drown until N is large.
Rough detection sizes you will meet again with formulas in Ep04 and Ep05:
- Tell 50% from 55% with serious confidence: on the order of ~400 trades.
- Tell 50% from 52%: on the order of ~2,500.
- Tell 50% from 51%: on the order of ~10,000.
Worked picture: you take 20 trades, 12 win, 8 lose (60% realised). Naïve read: “good strategy.” Honest read: with N = 20 the uncertainty band on true win rate is enormous. True p might be 60%. It might be 40%. You do not know yet. Ep36 (convergence card) is where “when have I earned trust?” becomes an operational gate, not a vibe.
Thread ahead: on even money, Kelly’s optimal fraction is f* = 2p − 1. At p = 0.55, f* = 0.10, the same number as the per-flip edge. That is not a coincidence. Ep08 will show maximising expected log-wealth and maximising expected rupee profit share one spine when payoffs are symmetric.
How this shows up on a real desk
1. The single-trade fallacy. Judging a sleeve by its most recent print. Even a true 60% system produces ugly losing streaks. Even a true 30% coin produces lucky winning streaks. Recent trades are statistically uninformative. The systematic job is to suspend judgement until sample size can speak.
2. Tip culture and lottery edges. Marketing sells dramatic edges. Real edges are small. If your “edge” only feels real when you narrate one winner, you are not measuring a class. You are collecting stories.
3. Overnight automation that still worships feelings. A desk can schedule nightly jobs and still let a human override size after a pain print, or lean in after a pleasure print. That quietly destroys size-by-evidence. Biology wants control. Markets punish that instinct when signal-to-noise is tiny.
4. Green dashboards with tiny N. A paper book with twenty labeled closes and a cheerful win rate is not a promotion case. It is a wide confidence interval wearing a green badge. Treat thin N as cold start, not as proof.
5. Confusing path P&L with class EV. A lucky path can look green while EV after costs is zero or negative. Ep03 forces the EV language. Ep01’s job is to stop you from treating the path as the class.
Three pillars (preview of the Part I spine)
Given that no single trade is informative, what does a profitable systematic trader actually do?
- Positive expected value after costs (Ep03). Without that, statistics cannot save you.
- Size by strength of evidence (later: Kelly). A 55% setup with good payoff is not the same risk as a 51% coin.
- Repeat at scale (Ep04). The law of large numbers converts theoretical edge into realised P&L.
Part I is that spine. Signals, LLMs, and fancy gates attach later. They do not replace it. If a later tool cannot state its class, its p, and its costs, it is decoration.
- Write down the class you claim (setup, horizon, costs) before the trade, not after the story.
- Refuse promotion language that cites one winner or one loser as proof of edge.
- Treat thin N as “unknown p,” not as a certified win rate.
- Separate outcome (one Bernoulli draw) from strategy properties (p, EV after costs).
- If automation exists, size mechanically. Do not let pain/pleasure retune risk mid-streak without a written gate.
- Bookmark the later trust gate (convergence / large N). Feeling ready is not the same as being measured.