You post a bid in a quiet market. Someone hits it. Did they sell because they had urgent liquidity needs (good for you - you bought below the mid and the price will likely recover), or did they sell because they have information that the price is about to drop (bad for you - you bought the falling knife)? Most of the time, individual trades are uninformative - you cannot tell. But the aggregate pattern across many trades does reveal something. When the order flow is heavily one-sided (many more sells than buys, or many more buys than sells), it is often because informed traders are pushing in one direction. VPIN tries to detect this pattern and warn liquidity providers (and any taker eyeing a trade) that the flow has turned dangerous.
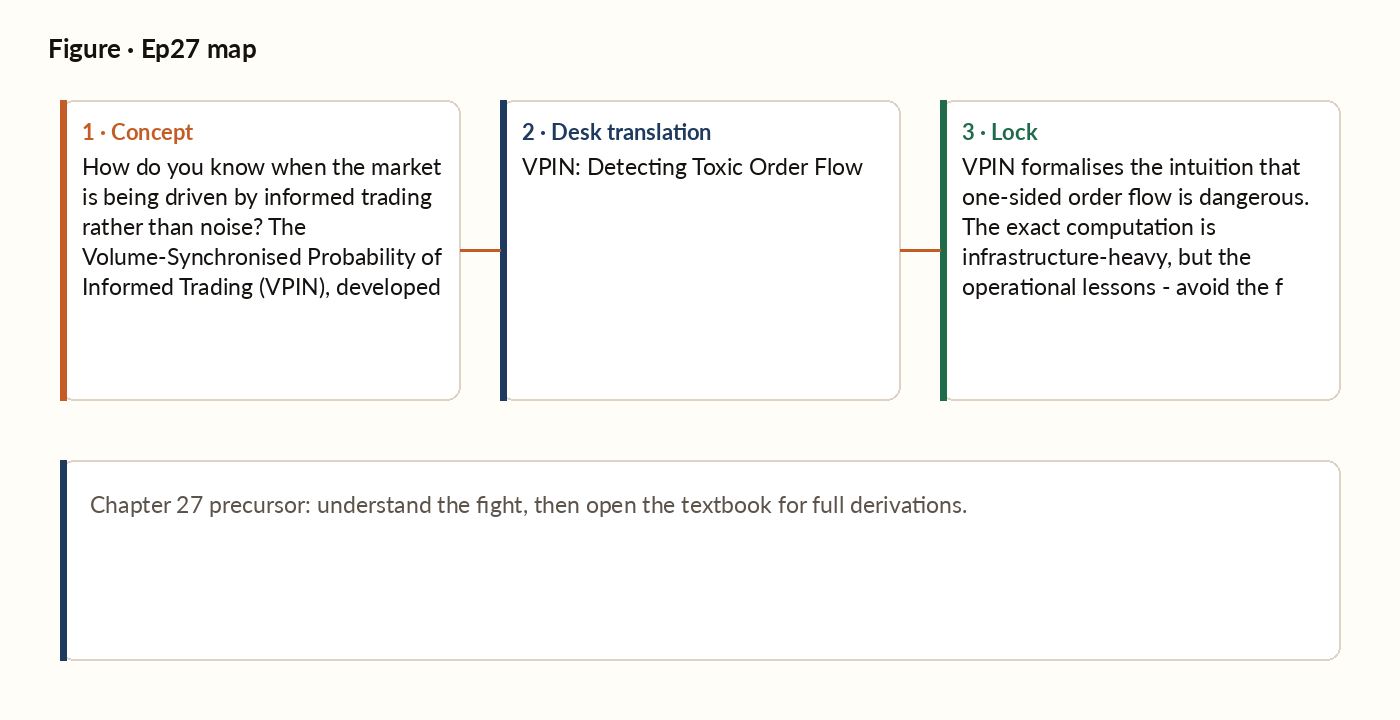
Figure 1. Concept map for this episode: fight, desk translation, what to lock.
The intuition
In any time window, some of the buying and selling is informed (motivated by private information) and some is uninformed (rebalancing, liquidity needs, hedging). When informed trading dominates, the order flow is unbalanced - there is much more buying than selling, or vice versa. When uninformed trading dominates, order flow is roughly balanced. VPIN measures the imbalance, normalised by total volume. High VPIN → unbalanced flow → high probability that informed trading is happening → adverse-selection risk for anyone taking liquidity.
The computation
The standard VPIN computation works in volume buckets, not time buckets. The reason: market activity varies wildly over the day; time buckets fail to compare like with like, while volume buckets capture the same amount of activity in each measurement. 1. Define a bucket size, e.g., 1/50 of the average daily volume. 2. Collect trades sequentially until the bucket fills. 3. For each trade in the bucket, classify as buyer-initiated or seller-initiated (using the Lee-Ready algorithm or trade-direction inference). 4. Compute the imbalance in each bucket (the absolute difference between buy volume and sell volume, divided by the bucket size) and average across the most recent buckets to get the VPIN reading.
Using VPIN as a risk filter
VPIN itself is a research tool, not a trading signal in most retail-scale systems (real-time tick-level VPIN computation requires infrastructure that most operators do not have). But the concept generalises into useful operational filters: Spread widening. When the bid-ask spread widens sharply, that is empirical evidence that market makers are pricing in adverse-selection risk - the same phenomenon VPIN captures. Halting new entries when spreads exceed a threshold is a practical analogue of VPIN-based filtering.
Worked picture
The 2010 Flash Crash - when the Dow Jones index dropped ~9% intraday and recovered within minutes - is the most-cited test of VPIN. In retrospective analysis by Easley, López de Prado, and O'Hara, VPIN had risen to historically extreme levels in the hour preceding the crash, suggesting that the order flow was already heavily imbalanced (and likely toxic) before the visible price collapse. This is the defensive use of VPIN: as an early warning that liquidity providers are facing extraordinary adverse-selection risk and may withdraw, leading to liquidity collapse. A trading system that respects elevated VPIN by reducing new entries would have avoided the worst of the crash. Critics note that VPIN's predictive power is contested in the academic literature, and that the Lee-Ready trade classification has limitations. The defensive interpretation (treat high VPIN as a yellow flag rather than a precise predictor) is more defensible than the predictive one.
What breaks in production
The standard trade-classification rule (the Lee-Ready algorithm) classifies a trade as buyer-initiated if it executes above the mid, seller-initiated if below, and uses a tick-test for trades at the mid. The classification is correct most of the time but not always. For VPIN to be accurate, the classification must be accurate. In modern markets with sub-tick mid changes and fast-moving quotes, the Lee-Ready rule misclassifies a meaningful fraction of trades. The resulting VPIN is biased - usually upward, because misclassifications tend to inflate apparent imbalance. The practical implication: do not rely on absolute VPIN thresholds. Use VPIN as a relative measure - "is today's VPIN higher than the trailing 30-day baseline?" - and gate trading on that relative signal. Relative thresholds are more robust to classification noise than absolute ones.
Key idea
VPIN formalises the intuition that one-sided order flow is dangerous. The exact computation is infrastructure-heavy, but the operational lessons - avoid the first 30 minutes, avoid the post-news window, halt when spreads widen abnormally - capture the same defensive discipline at a fraction of the implementation cost. The goal is not to compute VPIN; the goal is to not be the prey in moments of toxic order flow.