If you have not read Episode 00. The CEH-001 situation, read it first. Ep01 assumes you already see why CEH-001 has two honest marks (~1.50 and ~2.10) and why the midpoint 1.80 is denied. Starting here without Ep00 makes the ruler fight feel abstract.
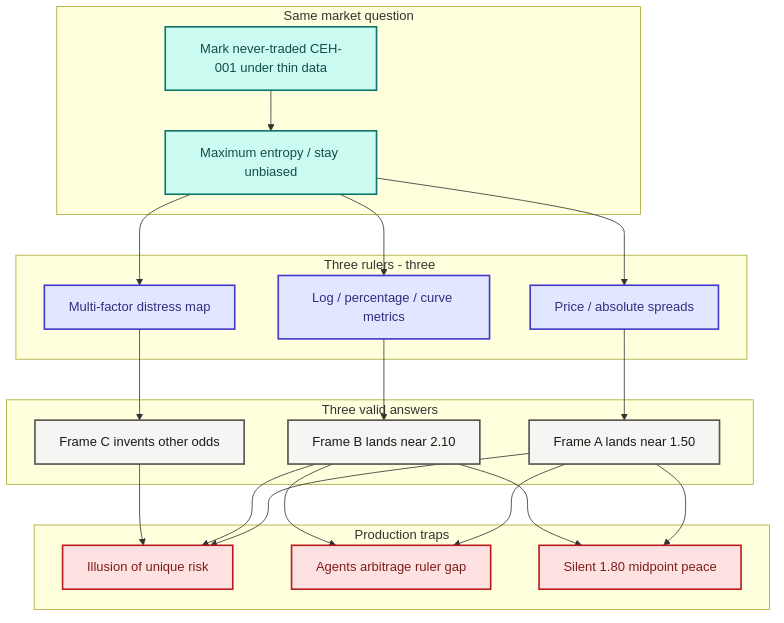
Same CEH-001 question, three rulers, three odds, and the traps that follow.
flowchart TB
  subgraph ASK["Same market question"]
    Q["Mark never-traded CEH-001 under thin data"]
    MAXE["Maximum entropy / stay unbiased"]
  end
  subgraph RULERS["Three rulers - three geometries"]
    R1["Price / absolute spreads"]
    R2["Log / percentage / curve metrics"]
    R3["Multi-factor distress map"]
  end
  subgraph ANS["Three valid answers"]
    A1["Frame A lands near 1.50"]
    A2["Frame B lands near 2.10"]
    A3["Frame C invents other odds"]
  end
  subgraph FAIL["Production traps"]
    ILL["Illusion of unique risk"]
    ARB["Agents arbitrage ruler gap"]
    MID["Silent 1.80 midpoint peace"]
  end
  Q --> MAXE
  MAXE --> R1 & R2 & R3
  R1 --> A1
  R2 --> A2
  R3 --> A3
  A1 & A2 & A3 --> ILL
  A1 & A2 --> ARB
  A1 & A2 --> MID
  classDef input fill:#CCFBF1,stroke:#0F766E,color:#134E4A,stroke-width:2px
  classDef decision fill:#FEF3C7,stroke:#B45309,color:#78350F,stroke-width:2px
  classDef risk fill:#FEE2E2,stroke:#B91C1C,color:#7F1D1D,stroke-width:2px
  classDef gate fill:#DCFCE7,stroke:#15803D,color:#14532D,stroke-width:2px
  classDef process fill:#E0E7FF,stroke:#4338CA,color:#312E81,stroke-width:2px
  classDef artifact fill:#F5F5F4,stroke:#57534E,color:#1C1917,stroke-width:2px
  class Q,MAXE input
  class R1,R2,R3 process
  class A1,A2,A3 artifact
  class ILL,ARB,MID risk
Here is a systems problem I keep running into when people talk about letting AI decide under uncertainty.
You cannot hand an underspecified problem to a model, tell it to stay unbiased, and expect a unique answer. In information theory that "least assumption" move is often maximum entropy. It only works after a human has already chosen how the space is measured.
Maximum entropy, in plain terms: if you do not know enough to prefer one outcome, pick the probability picture that adds the least extra story, while still matching the few facts you have (a known average, hard bounds, a correlation you measured). That sounds neutral. It is not. Neutrality starts after you pick the variables. Change the ruler and you change the "unbiased" answer. The math can still look clean in both cases.
Ep00 already showed this on CEH-001: Recipe A (neighborhood / peer spreads) lands near 1.50; Recipe B (rent-check / schedule) lands near 2.10. Averaging to 1.80 is inventing a third geometry. This episode names the general trap: Bertrand's Paradox for desks and agents.
Where the paradox comes from
Bertrand's Paradox is an old probability puzzle. Pick a random chord in a circle. What is the chance that chord is longer than the side of an equilateral triangle drawn inside the same circle?
Depends how you define random. Sample two endpoints on the circumference and you get one answer. Sample along a radius and you get another. Sample midpoints inside the disk and you get a third. Same question. Same circle. Three different probabilities. All of them are mathematically valid.
Financial AI sits in the same kind of trap. Only the "circle" is messy: returns, spreads, curves, liquidity, horizons. Frame the variables one way and the decision shifts. Frame them another way and it shifts again. Uniqueness is not free. It is purchased by contracting which frames are allowed.
Same market, different geometry
Say an AI is asked to judge risk with incomplete data and stay "unbiased." The parameterization alone can rewrite the story.
- Absolute price moves. A jump from 10 to 20 looks like any other +10. Useful for some P&L views. Blind to scale.
- Percentage / log growth. 10 to 20 is roughly a double; 90 to 100 is about 11%. Same dollar gap, different shape. Closer to how compounding behaves.
- Multi-factor distress map. Liquidity, volume, sentiment, volatility as coordinates, not a single price line. On CEH-001, peer-spread space and curve-implied space play this role for the two honest marks.
All three views can be legitimate. Run maximum entropy inside each one and you can get very different strategies, allocations, and crash odds. Each run still claims to be the least biased answer available.
How this shows up in production
1. The illusion of risk. Sparse crash history, ask for a probability, model reaches for maximum entropy to look unbiased. Build it on absolute prices and you get one crash number. Rebuild on log returns and the same principle spits out another. Confidence can stay high either way. What often goes unadvertised is that the variable definition already baked in a structural bias.
2. The arbitrage trap. Agent A lives in price (or spread) space. Agent B lives in curve / distress space. Under uncertainty they can mark different "fair" values for the same claim. Both can be internally consistent. Both can call themselves unbiased. That gap is not automatically real edge. Sometimes it is two rulers disagreeing. If those agents trade or size against each other on that disagreement, you can get feedback loops that chew liquidity, not because the market "lied," but because the coordinate systems never matched. On CEH-001 that is exactly the 1.50 vs 2.10 gap dressed as a trade idea.
3. Invariance checks. A serious risk number should survive the transforms finance actually cares about: change of scale, currency, inflation adjustment, log vs linear when compounding matters. If an allocation looks fine in one unit system and quietly changes shape in another that should have been equivalent, the model found Bertrand again. The answer depended on the ruler.
4. Specification overfitting (research gap to name early). Teams often optimize the one metric they wrote down (holdout accuracy, a calm-pack score) and never stress the measurement frame itself. Research practice that helps: preregister the allowed frames and the conflict policy before training; eval alternate parameterizations, not only holdout; treat multi-metric results as competing specs, not as a free average (see work on specification overfitting in AI evaluation).
Back to CEH-001 pricing
Model X starts from raw peer spreads (Recipe A), applies maximum entropy in that space, lands near 1.50. Model Y starts from continuous curve / schedule metrics (Recipe B), applies the same entropy idea in its space, lands near 2.10. Both can claim they stayed unbiased inside their own setup. They still disagree. More GPU hours will not resolve that by themselves.
What resolves it is ownership of the frame: dual marks on the ticket, no blend field, human choice of which job uses which ruler, and a harness that returns refuse / inconclusive when a uniqueness job cannot be honest.
What to lock before the model runs
- Guardrails are more than content filters. They constrain decision geometry.
- Write down the measurement frame (and allowed alternate frames) before the model runs.
- Eval should poke alternate parameterizations, not just holdout accuracy.
- If you run multiple agents, they need shared invariances, or they arbitrage each other's coordinate systems.
- "Maximum entropy" or "least biased" is a useful default and a bad slogan if the space is fuzzy.
- On dual-frame nameplates like CEH-001: emit dual marks. Never mint uniqueness by averaging.
Building reliable AI research infrastructure is less about letting the model "decide freely" and more about making those geometric choices explicit, testable, and owned by people.